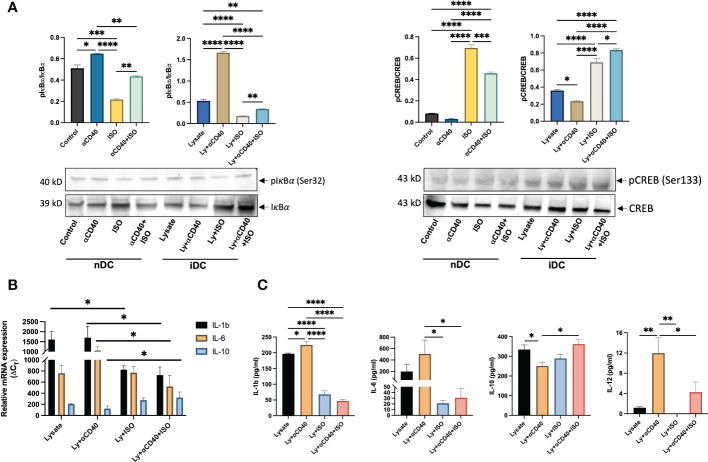
Figure 4.
Analysis of Phosphorylated IkBα and CREB levels in nDCs and iDCs treated with ISO (1µM) and αCD40 (10 µg/ml) for 48h. (A) Western blots showed reduced pIkBα levels compared to unphosphorylated IkBα in the presence of ISO in both αCD40 treated nDCs and iDCs. ISO treatment increased pCREB levels in both nDCs and iDCs, with or without αCD40 treatment. The ratio of phosphorylated to unphosphorylated forms is shown as the intensity graphs. Respective GAPDH blots used to normalize the band intensities are shown in Figures S4A, B and the normalized band intensities are summarized in Figure S5C . (B) Gene expression analysis revealed that αCD40+ISO treatment significantly decreased IL-1β & IL-6 levels in iDCs compared to αCD40 treatment alone, and increased IL-10 expression in these cells. The results are expressed as 2^ΔCT with respect to GAPDH levels. (C) The release of IL-1β, IL-6 & IL-10 in the culture supernatant of co-treated iDCs showed a similar trend, with αCD40-mediated increase in released IL-12 significantly declining with ISO treatment. Statistical analysis was carried out using One-way ANOVA. P values less than 0.05 were considered significant. * P <0.05, ** P <0.005, *** P <0.0005, **** P <0.0001.

