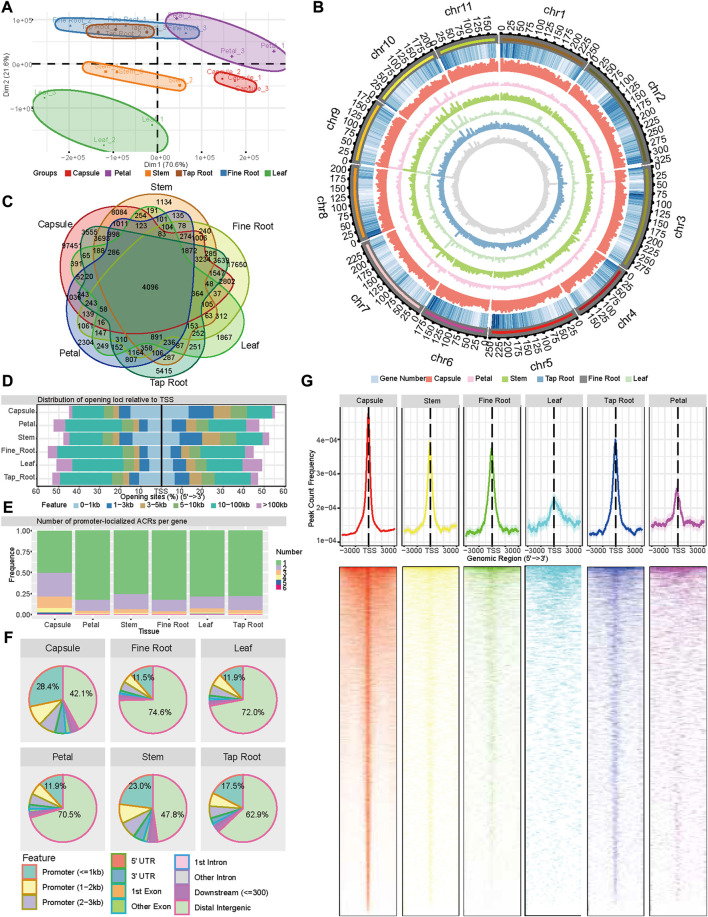
FIGURE 1.
Landscape of accessible chromatin regions across six tissues (capsule, leaf, petal, stem, tap root, and fine root) of P. somniferum. (A) Graphical representation of PCA of opium poppy ATAC-seq data between all the biological replicates across the six tissues based on ACR. (B) Genome-wide distribution of ACRs along 11 opium poppy chromosomes. From outside to inside, the circles represent the chromosome, gene density, ACRs abundance in the capsule, ACRs abundance in the petal, ACRs abundance in the stem, ACRs abundance in the leaf, ACRs abundance in the tap root, and ACRs abundance in the fine root. (C) Venn diagram displaying the number of common and unique ACRs among the six distinctive tissues. (D) Distribution of ACRs relative to genes in each tissue. (E) Number of promoter-localized ACRs per gene in each tissue. (F) Genomic annotation and distribution of ACRs in the six tissues. (G) Distribution of promoter-localized ACRs in the six tissues.

