Figure 1.

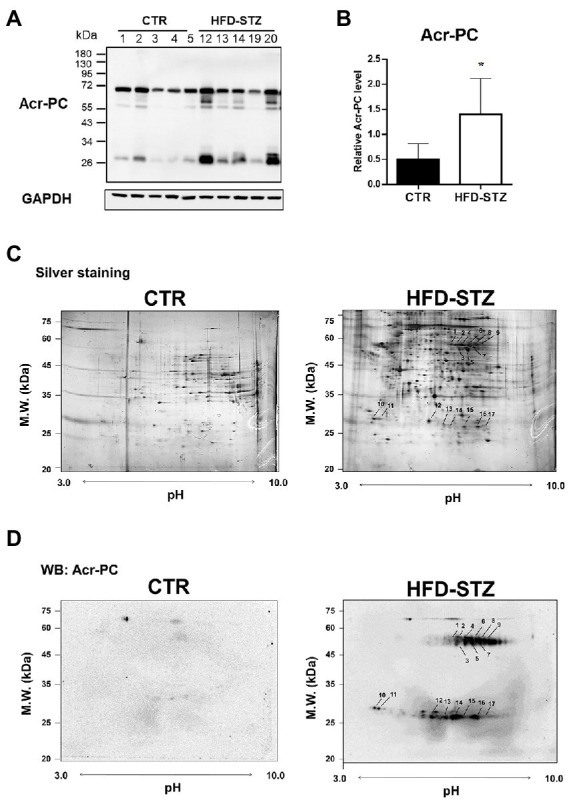
2D-SDS-PAGE in combination with Western blotting in kidney tissues of HFD-STZ-induced DN mice and vehicle control mice. Male 6-week-old C57BL/6 J mice were fed a normal diet or a high-fat diet (HFD) for 16 weeks. HFD-fed mice (n = 5) were treated with freshly prepared STZ (50 mg/kg/d, i.p.) for seven consecutive days, followed by continued HFD feeding for an additional 12 weeks. (A) Western blot analysis of Acr-PC levels in HFD-STZ-induced DN mice (HFD-STZ, n = 5) and vehicle control mice (CTR, n = 5). (B) Quantification of (A). The values are presented as the mean ± standard deviation (SD). Mann–Whitney tests were used to determine statistical significance, and two-tailed p values are shown. *p < 0.05 compared with the control group. (C,D) A representative 2-D PAGE image of kidney tissues from HFD-STZ-induced DN mice (#20) and vehicle control mice (#1) was visualized by (C) silver staining and (D) Western blot analysis. All the identified spots were localized in the perfusion index (pI) 3–10 range with a molecular mass range of 20–75 kDa. Seventeen protein spots were significantly increased in HFD-STZ-induced DN mice compared to vehicle control mice based on Western blot 2D gel patterns. These corresponding spots on silver-stained 2D gel were excised from the gel and incubated with trypsin to digest the proteins in the gel, which were then analyzed by LC–MS/MS. Protein spots identified by LC–MS/MS (arrow) are marked by their spot numbers.
