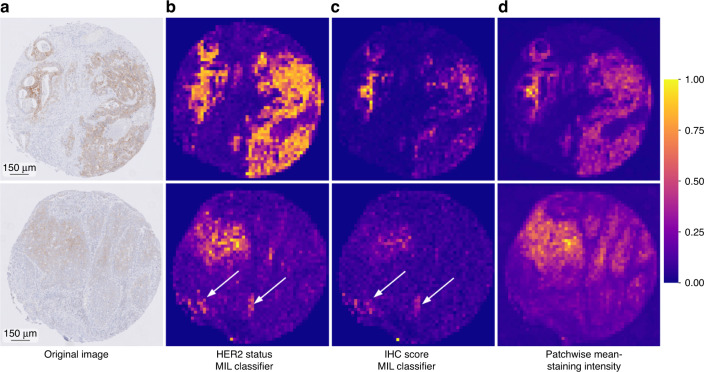
Fig. 3. Heatmap visualisations of the attention value and mean-staining intensity in tiles within the tissue image.
The values are normalised to [0, 1]. a Slides with IHC score 2 and negative HER2 status. b Attention score heatmap of HER2 status MIL classifier. c Attention score heatmap of IHC score MIL classifier. d Patchwise mean-staining intensity heatmap. White arrows point to locations where the attention values do not match staining intensity.

