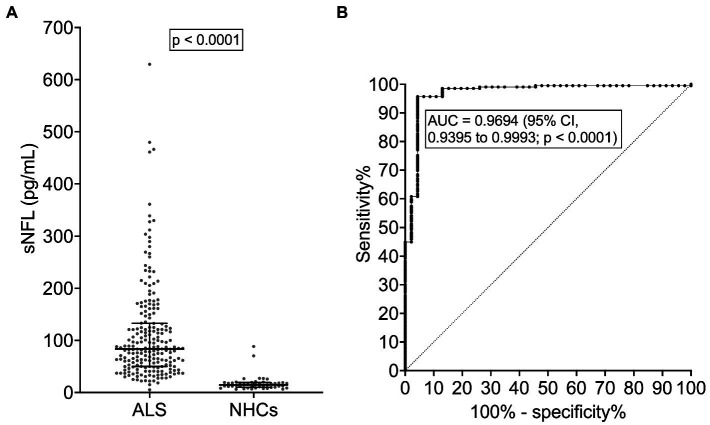
Figure 1.
Serum NFL levels in ALS patients and neurologically healthy controls. (A) sNFL levels in ALS patients and NHCs. Wide horizontal bars represent median values, narrower horizontal bars represent first and third quartiles. (B) ROC curve of the discrimination between ALS patients and NHCs. ALS, amyotrophic lateral sclerosis; AUC, area under the curve; CI, confidence interval; NFL, neurofilament light chain; NHCs, neurologically healthy controls; ROC, receiver operating characteristic; sNFL, serum neurofilament light chain.

