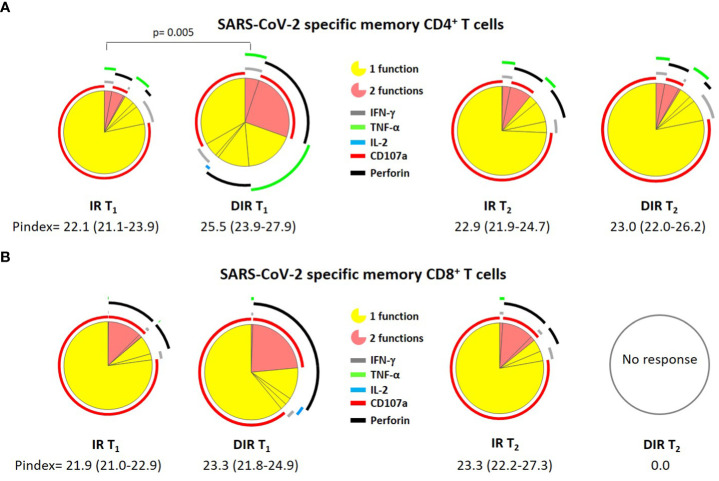
Figure 8.
Pie charts representing (A) SARS-CoV-2 S–specific memory CD4+ and (B) CD8+ T cell polyfunctionality. Each sector represents the proportion of S-specific CD4+ T cells producing 1 (yellow) or 2 (red) functions. Arcs represent the type of function (IFN-γ, IL-2, TNF-α, CD107a, and perforin) expressed in each sector. IR, immune responders. DIR, discordant immune response. T1 and T2 a median of 33 and 166 days after the second ARN vaccine dose.

