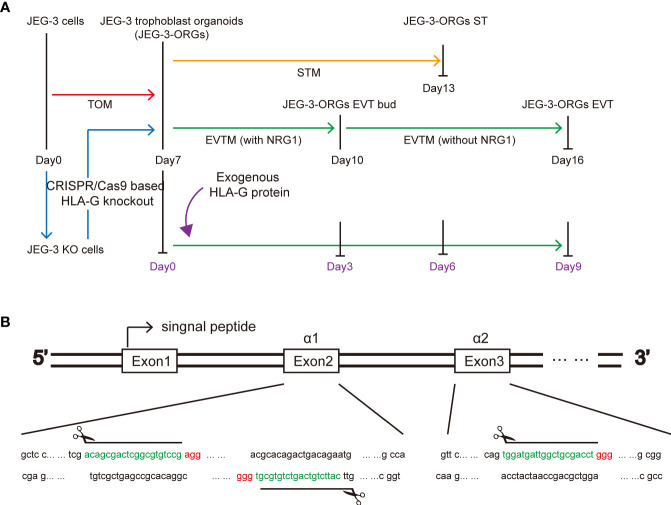
Figure 1.
HLA-G study based on JEG-3 trophoblast organoids and the CRISPR/Cas9 approach. (A) Schematic illustration of the formation of the trophoblast organoid and differentiation model. Red, orange, green, blue, and purple represent TB-ORG formation, ST differentiation, EVT differentiation, HLA-G knockout, and exogenous HLA-G treatment, respectively. (B) Genomic sequence for the HLA-G knockout targeted region. The PAM sequences are indicated in red. The small guide RNA sequences are underlined in green.

