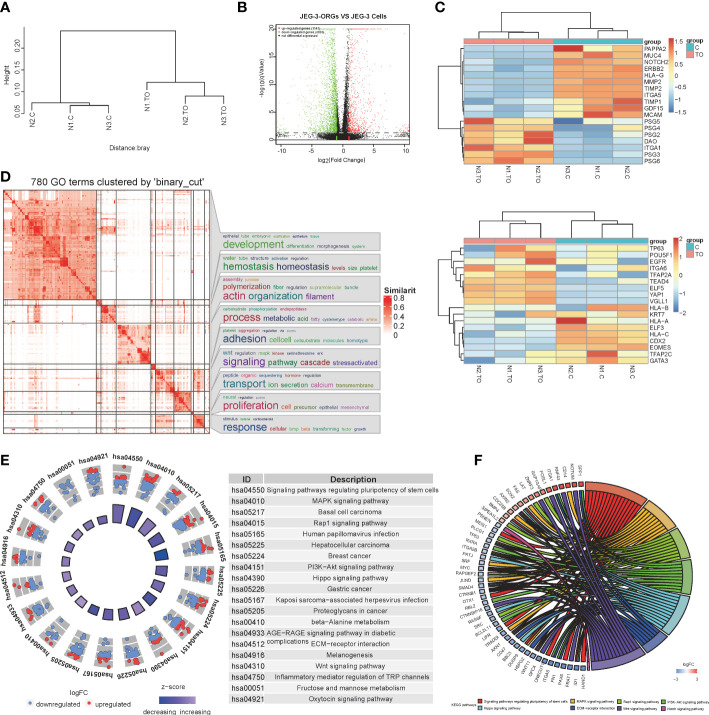
Figure 3.
RNA-sequencing analysis for the process of JEG-3-ORG formation. (A) Hierarchical clustering for JEG-3-ORGs and JEG-3 cells. (B) Volcano plot showing DEGs of the JEG-3 cell reprogramming. Red points represent significantly upregulated genes, green points represent significantly downregulated genes, and gray points represent genes that were not significantly differentially expressed. The criteria for DEGs is a |log2FC|>2 and a q-value of <0.05. (C) Clustered heat map showing expression of the selective identity markers for subtype trophoblasts. The upper panel shows ST- and EVT-classified genes and the lower panel shows TSC and CTB markers. (D) Simplified GO terms enrichment. (E) Circle diagram of the top 20 KEGG enriched signaling pathways. (F) Chord plot for crosstalk, covering the top 7 enriched canonical pathways.

