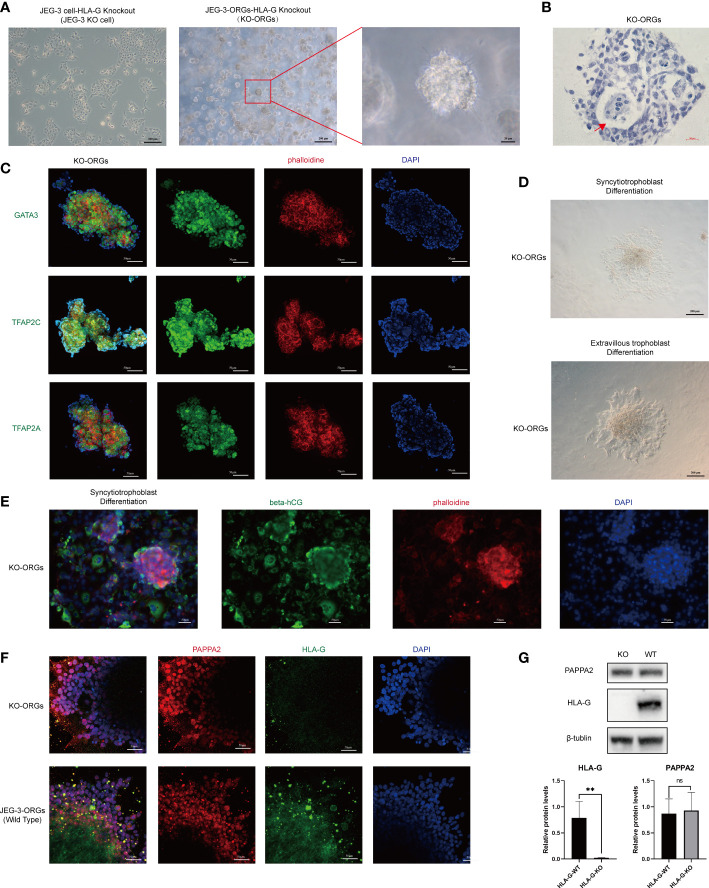
Figure 5.
Formation of trophoblast organoids through reprogrammed JEG-3 KO cells. (A) Images of the different cultured statuses of JEG-3 KO cells. Left, two-dimensional culture; middle and right, three-dimensional culture. (B) Hematoxylin staining images of the cross-section of KO-ORGs. The red arrow indicates the intercellular vacuoles. (C) Immunofluorescence staining images of GATA3, TFAP2A, and TFAP2C in KO-ORGs. (D) Generation of syncytiotrophoblast and extravillous trophoblast from KO-ORGs. (E) Immunofluorescence staining images of beta-hCG at the ST differentiation stage of KO-ORGs. (F) Immunofluorescence staining images of PAPPA2 and HLA-G at the EVT differentiation stage of two kinds of JEG-3-ORGs. (G) Protein expression of HLA-G and PAPPA2 at the EVT differentiation stage of two kinds of KO-ORGs. Top, blot; bottom, quantification of relative protein levels. **P<0.01; ns, not significant. n = 3 in triplicate.

