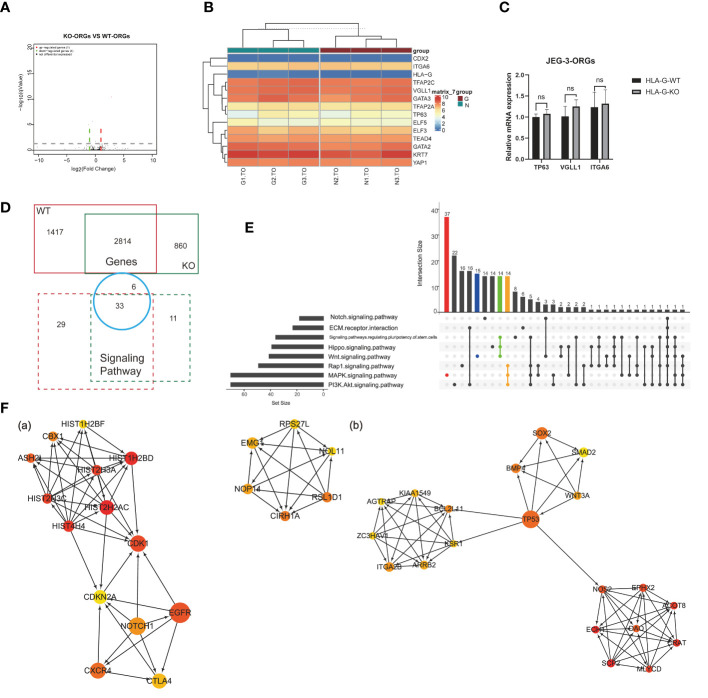
Figure 6.
Comparison analysis for different DEGs in JEG-3-ORG formation. (A) Volcano plot showing DEGs between KO-ORGs and WT-ORGs. (B) Clustered heat map showing the expression of the selective TSC and CTB classified genes. (C) Quantification of relative mRNA expression of ITGA6, VGLL1, and TP63 between KO-ORGs and WT-ORGs. (D) Diagram of the shared or individual genes and signaling pathways for two types of JEG-3 cell reprogramming. (E) UpSet plot showing intersections among the common signaling pathways. Coloured bars show genera/taxa exclusively observed in the “MAPK”, “PI3K/Akt” and “Wnt” signaling pathways and intersective pathways. (F) PPI network analysis of the individual DEGs expressed in KO-ORGs and WT-ORGs. Ten hub genes were selected using the plug-in cytoHubba of Cytoscape based on MCC scores. (A) Network based on 1,417 individual DEGs for the WT group. (B) Network based on 859 individual DEGs for the HLA-G KO group. ns, not significant.

