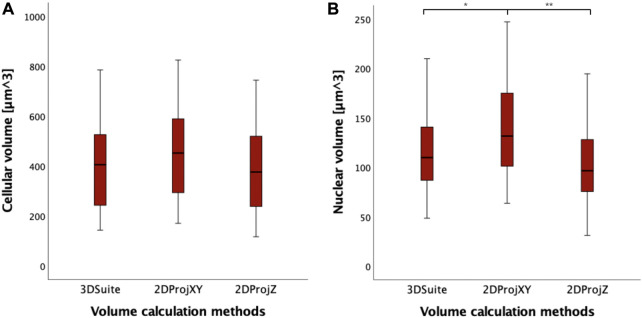
FIGURE 7.
(A) Boxplots of cell volumes expressed in µm3, calculated with different methods (3DSuite, 2DProjXY, and 2DProjZ). (B) boxplot of nucleus volumes expressed in µm3, calculated with different methods (3DSuite, 2DProjXY, and 2DProjZ). The symbol * represents a statistically significant difference (*p < 0.05; **p < 0.01; ***p < 0.001).

