FIGURE 2.
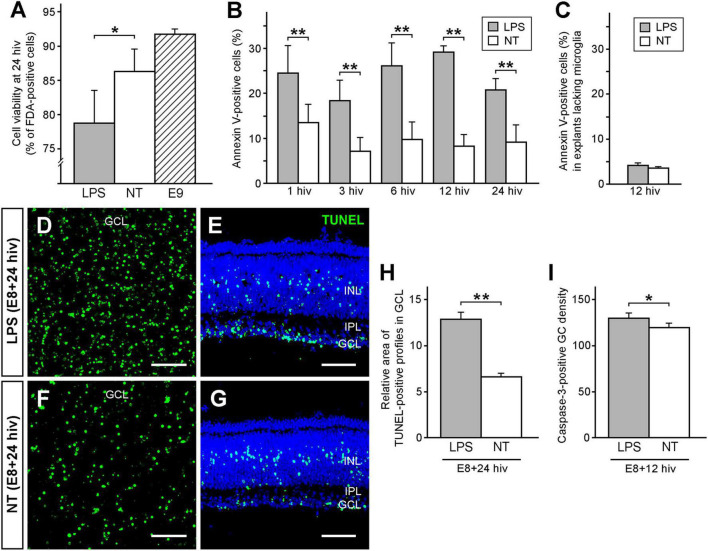
LPS treatment decreases cell viability and increases cell death in retina explants prepared from quail embryos cultured for 24 h in vitro (E8 + 24 hiv). (A) Cell viability in LPS-treated (LPS, grey bar) and non-treated (NT, white bar) E8 + 24 hiv retina explants compared with that in non-cultured E9 retina explants (E9, striped bar). Cell viability is expressed as the percentage of fluorescein diacetate (FDA)-positive cells from the whole cell population, which was obtained by flow cytometry analysis of retina explant cell suspensions treated with FDA, that labels viable cells, and propidium iodide, that stains dead cells. Data are expressed as means ± SEM (n = 9 for each condition). The percentage of viable cells is significantly lower in LPS-treated E8 + 24 hiv retina explants versus non-treated explants, while it is not significantly different between non-treated explants and non-cultured E9 retina explants (*P < 0.05, one-way ANOVA followed by Tukey test for multiple comparisons). (B) Percentages of annexin V-positive cells in E8 retina explants cultured for 1, 3, 6, 12, and 24 hiv in the presence (grey bars) or the absence (white bars) of LPS, as determined by flow cytometry analysis of cell suspensions from retina explants stained with EGFP-conjugated annexin V. Data are expressed as means ± SEM (n = 6 for each condition). The percentages of annexin V-positive cells are significantly higher in LPS-treated than in non-treated explants at all in vitro time points (**P < 0.01, one-way ANOVA followed by Tukey test for multiple comparisons). (C) Percentages of annexin V-positive cells in E8 retina explants lacking microglia cultured for 12 hiv in the presence (grey bars) or the absence (white bars) of LPS, as determined by flow cytometry analysis of cell suspensions from retina explants stained with EGFP-conjugated annexin V. Data are expressed as means ± SEM (n = 6 for each condition). Note that there are no significant differences between the percentages of annexin V-positive cells in LPS-treated and non-treated explants (P = 0.14, Student’s t-test). (D–G) Representative confocal images of TUNEL-stained (green) whole-mounts (D,F) and cross sections (E,G) from LPS-treated [LPS; (D,E)] and non-treated [NT; (F,G)] E8 + 24 hiv retina explants. Images of whole-mounted explants are maximum-intensity projections from Z stacks of confocal optical sections throughout the thickness of the ganglion cell layer (GCL). Explant cross-sections were stained with Hoechst 33342 (blue) to visualize the retinal layers (INL: inner nuclear layer; IPL: inner plexiform layer). Note that TUNEL-positive profiles in the GCL are more abundant in LPS-treated (D,E) than non-treated (F,G) explants. Scale bars: 50 μm. (H) Relative areas of TUNEL-positive profiles in the GCL of LPS-treated (LPS, grey bar) and non-treated (NT, white bar) E8 + 24 hiv retina explants. Bars represent percentages of TUNEL-positive pixels in the GCL of whole-mounted explants as measured on three microscopic fields of 250 μm × 250 μm per explant. Data are represented as means ± SEM (n = 17 for each condition). The relative area of TUNEL-positive profiles is significantly higher in LPS-treated versus non-treated explants (**P < 0.01, Student’s t-test). (I) Caspase-3-positive ganglion cell densities in LPS-treated (LPS, grey bar) and non-treated (NT, white bar) E8 + 12 hiv retina explants. Data are presented as means (±SEM) of caspase-3-positive ganglion cells per mm2 obtained from counts in three square fields of 500 μm × 500 μm per whole-mounted retina explant (n = 6 for each condition). The density of caspase-3-positive ganglion cells is significantly higher in LPS-treated than in non-treated explants (*P < 0.05, Student’s t-test).

