FIGURE 3.
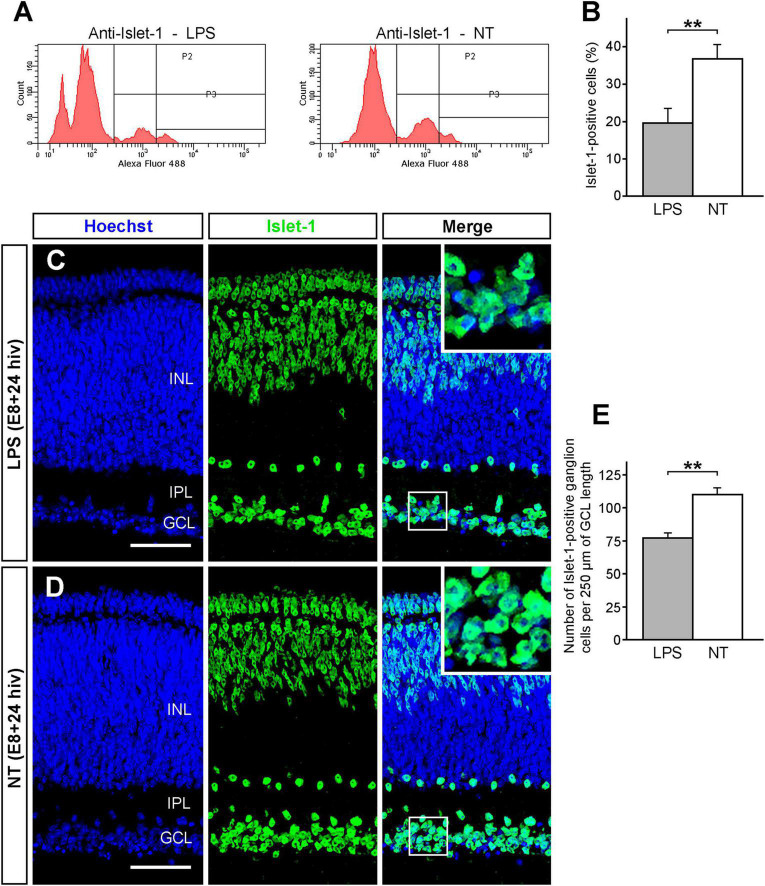
Decrease of the ganglion cell population after LPS treatment. The Islet 1-positive ganglion cell population significantly declines after LPS treatment in retina explants from E8 quail embryos cultured for 24 h in vitro (E8 + 24 hiv). (A) Representative histograms showing flow cytometry analysis of cell suspensions from LPS-treated (LPS) and non-treated (NT) E8 + 24 hiv retina explants immunolabeled with the anti-Islet 1 antibody and revealed with Alexa Fluor-488-conjugated anti-mouse IgG. In the two histograms, P2 and P3 represent the Islet 1-positive cell population that is distinctly lower in LPS-treated than non-treated explants. (B) Percentages (means ± SEM) of Islet 1-positive cells obtained in the flow cytometry analysis of cell suspensions from LPS-treated (LPS, grey bar) and non-treated (NT, white bar) retina explants (n = 8 for each condition). The Islet 1-positive cell percentage is significantly lower in LPS-treated versus non-treated explants (**P < 0.01, Student’s t-test). (C,D) Representative confocal images of anti-Islet 1 (green) immunolabeled cross-sections from LPS-treated [LPS; (C)] and non-treated [NT; (D)] E8 + 24 hiv retina explants. Nuclear stain with Hoechst 33342 (blue) was used to visualize the retinal layers (INL: inner nuclear layer; IPL: inner plexiform layer; GCL: ganglion cell layer). Blue, green and merged channels are shown in the left (Hoechst), medium (Islet 1) and right (Merge) panels, respectively. Insets in the right panels show higher magnifications of the boxed areas. The Islet 1-positive ganglion cells appear to be less numerous in LPS-treated explants (C) compared to non-treated ones (D). Scale bars: 45 μm. (E) Quantification of Islet 1-positive cells in the GCL of LPS-treated (LPS, grey bar) and non-treated (NT, white bar) E8 + 24 hiv retina explants. The quantitative analysis was performed on three cross sections from dorsal, medial, and ventral parts of LPS-treated and non-treated explants (n = 8 for each condition). Data are expressed as means (±SEM) of numbers of Islet 1-positive cells per 250 μm of GCL length in each histological section. The number of Islet 1-positive ganglion cells is significantly lower in LPS-treated than in non-treated explants (**P < 0.01, Student’s t-test).

