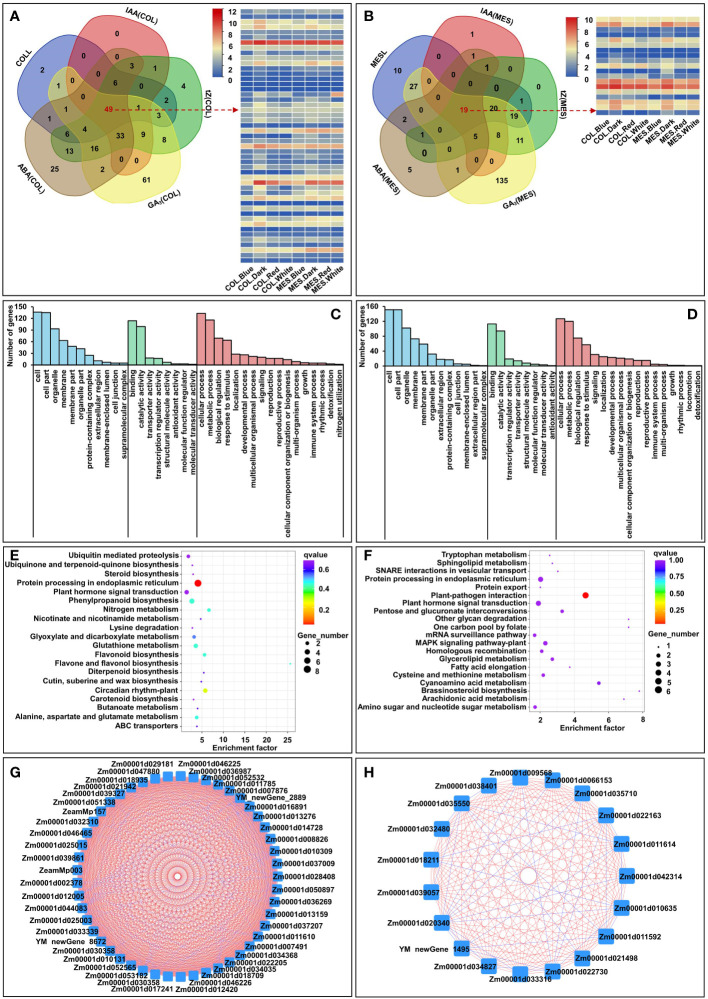
Figure 8.
Venn diagram of burlywood module’ eigengenes in coleoptile (COL) to detect 251 unique genes and 49 common genes, which had a strong correlation with five corresponding traits, including coleoptile length (COLL), indole-3-acetic acid content in COL [IAA(COL)], trans-zeatin content in COL [tZ(COL)], gibberellin 3 content in COL [GA3(COL)], abscisic acid content in COL [ABA(COL)] [gene significance (GS) > 0.8], and the expression profiles of 49 common genes in burlywood module (A). GO and KEGG analysis of 251 unique genes in burlywood module (C, E). Hub genes network interaction in burlywood module in COL (G). Venn diagram of darkseagreen2 and lightsteelblue modules’ eigengenes in mesocotyl (MES) to detect 267 unique genesand 19 common genes, which had a strong correlation with five corresponding traits, including mesocotyl length (MESL), IAA content in COL [IAA(MES)], tZ content in MES [tZ(MES)], GA3 content in MES [GA3(MES)] (GS > 0.7), ABA content in MES [ABA(MES)], and the expression profiles of 19 common genes in darkseagreen2 and lightsteelblue modules (B). GO and KEGG analysis of 267 unique genes in darkseagreen2 and lightsteelblue modules (D, F). Hub genes network interaction in darkseagreen2 and lightsteelblue modules in MES (H).

