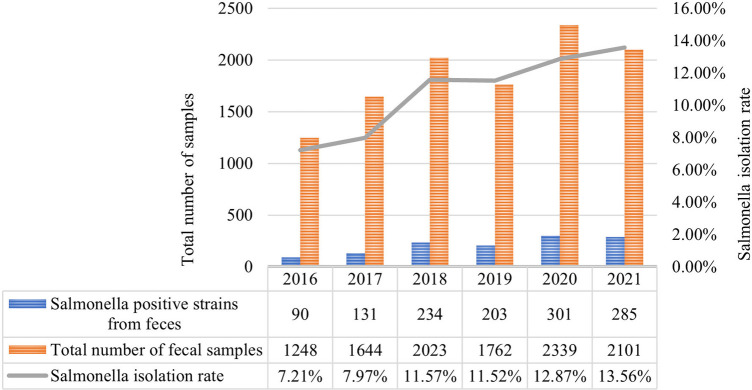
Figure 2.
Annual distribution of Salmonella isolated from feces from 2016 to 2021. The bar chart represents the total number of fecal samples and Salmonella positive strains from feces. The Salmonella isolation rate of 6 years is shown in the line graph. Salmonella exhibited an increasing trend year by year.

