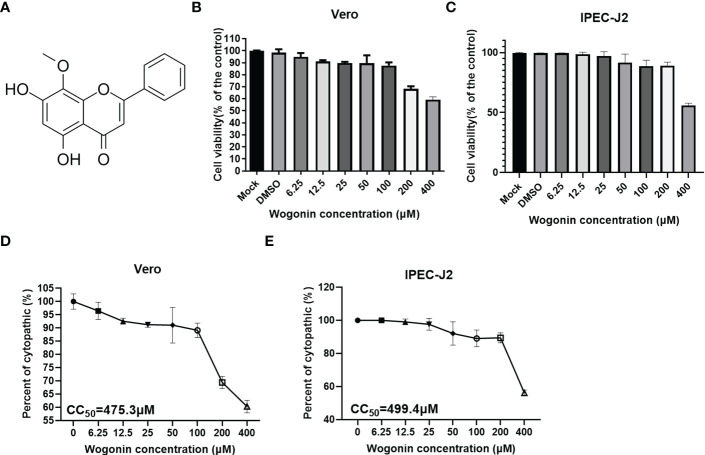
Figure 1.
Cytotoxicity of wogonin on Vero cells. (A) Structure of Wogonin. (B, C) Evaluation of cell viability using CCK-8 assay. All the values were normalized to the control group, representing 100% cell viability. The Vero (B) and IPEC-J2 (C) cells were treated or not treated with wogonin at 48 h. Representative results of at least three independent experiments have been indicated. (D, E) CC50 values were calculated using GraphPad Prism software 7.0.

