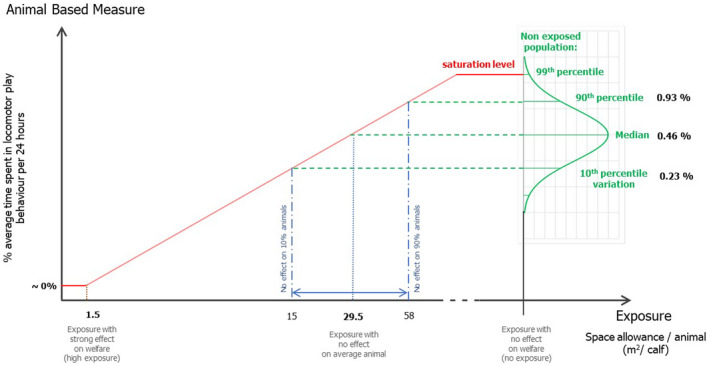
Figure 20.

Schematic representation of theoretical model estimating space allowances and its relationship with time spent in locomotor play behaviour, showing order of elicited points (1st step, 2nd step, etc.) and elicited values for calves kept in individual enclosures (elicited values are shown in black). The green, vertical distribution represents the variability in play behaviour expected in a population of calves placed in a location with unrestricted space (e.g. large field, ‘no exposure’). A linear relationship between increasing space allowances (m 2 per animal) and % of time spent in play behaviour was assumed (red line)
