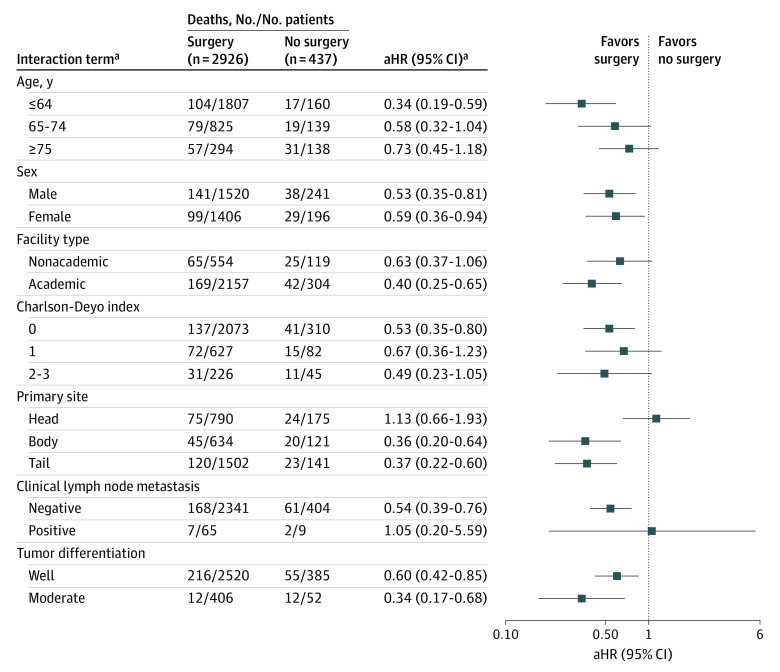
Figure 3. Forest Plot of the Association of Surgery With Mortality in Subgroup Analyses.
The plot was done on a log scale. The position of each square represents the point estimate of the outcome of surgery, and error bars represent 95% CIs. The vertical line indicates a hazard ratio of 1.0, which was the null hypothesis value. aHR indicates adjusted hazard ratio.
aAll interactions were tested in 1 model, which was adjusted for age, sex, facility type, Charlson-Deyo index, tumor location, clinical lymph node metastasis, tumor differentiation, tumor histologic distribution, and chemotherapy type. The HR was estimated for each interaction coefficient using the unresected group as the reference.

