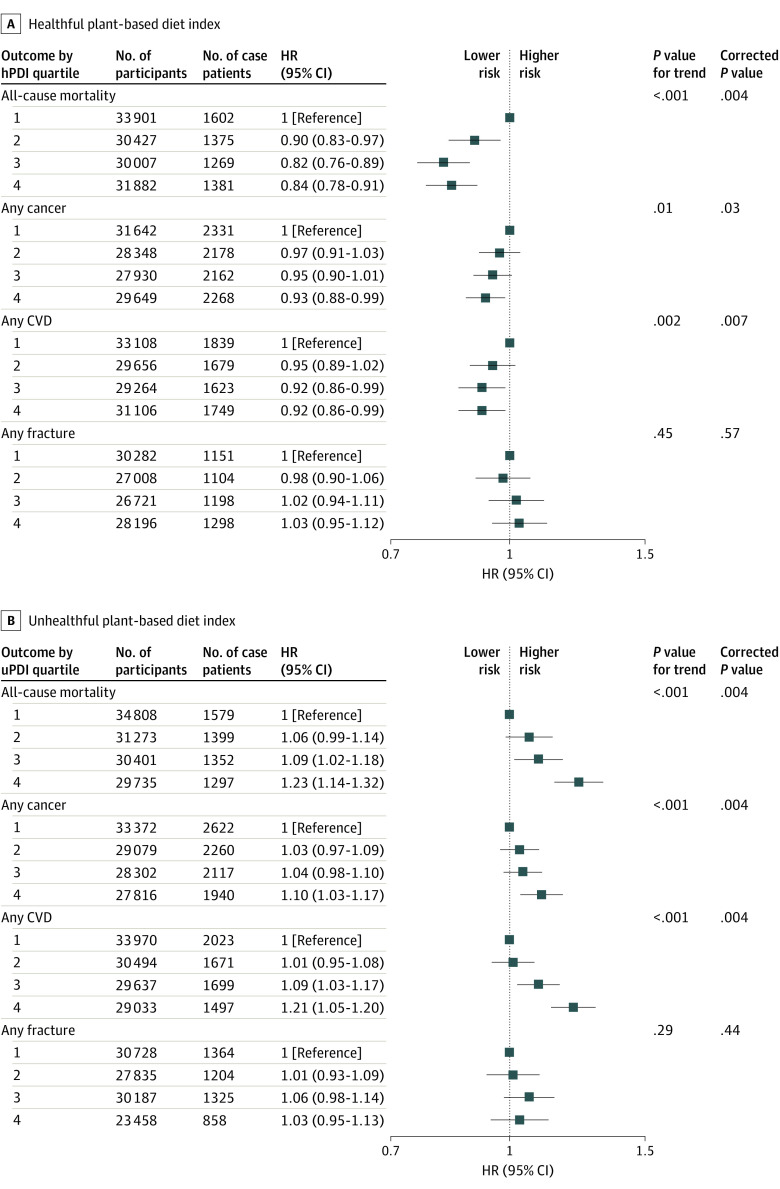
Figure 1. Multivariable-Adjusted Hazard Ratios and 95% CIs for All-Cause Mortality (n = 126 217), Cancer (n = 117 569), Cardiovascular Disease (CVD; n = 123 134), and Fracture (n = 112 208) Across Sex-Specific Healthful vs Unhealthful Plant-based Diet Index Quartiles.
All models used age as the underlying time variable and were adjusted for sex, body mass index, race and ethnicity, physical activity level, smoking status, alcohol intake, education level, energy intake, polypharmacy index, multimorbidity index, and aspirin use, stratified by region. For all-cause mortality analyses, models were further adjusted for prevalent CVD and prevalent cancer. For any cancer analyses, models were further adjusted for menopausal status and use of menopause hormone therapy. For any CVD analyses, models were further adjusted for polygenic risk score. For any fracture analyses, models were further adjusted for vitamin or mineral supplement use and polygenic risk score (osteoporosis). hPDI indicates healthful plant-based diet index; HR, hazard ratio; uPDI, unhealthful plant-based diet index.

