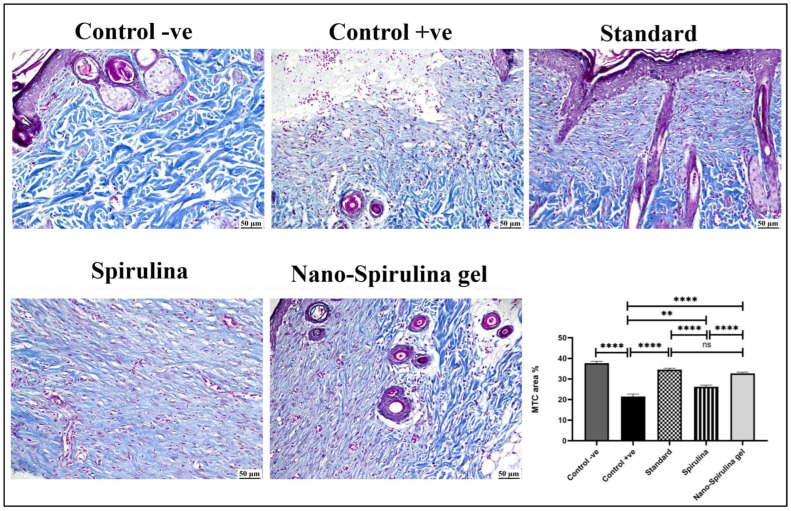
Figure 13.
Photomicrograph of skin (MTC) stained showing high collagen content (blue color) in the -ve control group, decreased collagen content in the +ve control group, increased collagen in the standard group, a moderate increase in collagen in the S. platensis gel group, and markedly increased collagen in the nano-S. platensis gel (SPNP-gel) group. The chart describes the amount of collage expressed as area percent of blue color, data were presented as means ± SD, and a significant difference was considered at p ˂ 0.05. Note: GpI/control negative (-ve): non-wounded rats; GpII/control positive (+ve): untreated wounded rats; GpIII/standard group: wounded rats treated with MEBO®; GpIV/S. platensis gel: wounded rats treated with S. platensis gel; and GpV/nano-spirulina (SPNP)-gel: wounded rats treated with SPNP-gel. Number of asterisks “*” above the columns indicates strength of significance.

