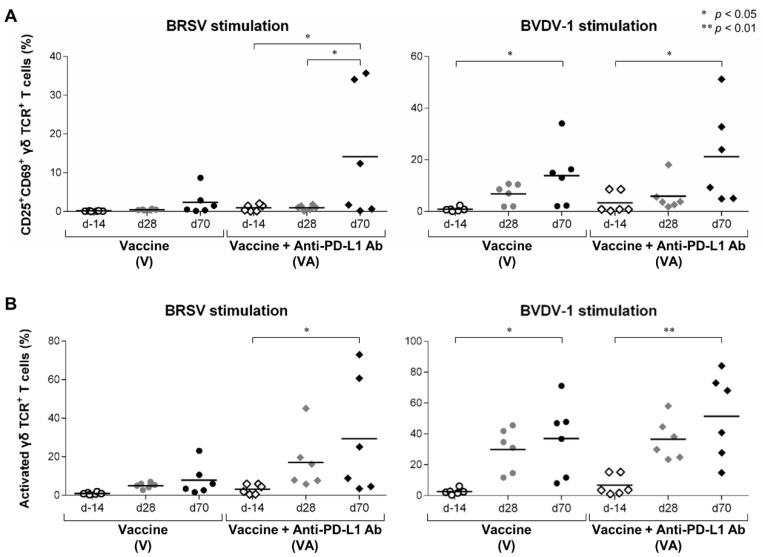
Figure 5.
Activation of γδ T-cell responses following vaccination and PD-L1 blockade. (A,B) Proportions of CD25+CD69+ cells (A) and AIM+ cells (CD25+CD69+, CD25+CD69−, and CD25−CD69+ cells) (B) in the CD3+γδTCR+ T cells fraction of PBMCs stimulated with BRSV (left) or BVDV-1 antigen (right). PBMCs isolated from calves that had been administered Calfwin 6 only (circle, n = 6) or Calfwin 6 and anti-PD-L1 Ab (diamond, n = 6) on day 14 (white), day 28 (gray), and day 70 (black) were cultured in the presence of BRSV or BVDV-1 antigen for seven days. The expression of CD25 and CD69 in each subpopulation was analyzed by flow cytometry. Gating strategies and representative dot plots for flow cytometric analysis are shown in Figure S3. Significant differences among groups were determined using Tukey’s test. * p < 0.05. ** p < 0.01.

