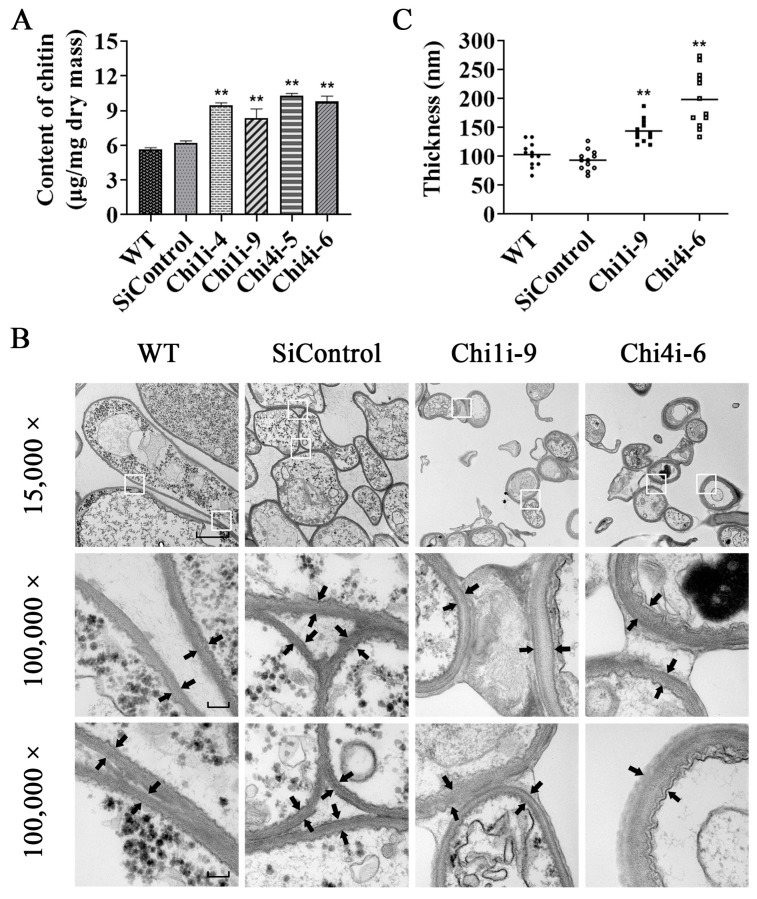
Figure 5.
Transmission electron microscopy (TEM) analysis of cell wall thickness in chitinase-silenced strains and WT. (A) Determination of the chitin content in chitinase-silenced strains. Standard errors and means were determined from three independent replicates. Asterisks indicate significant differences compared to the WT strain according to two-way analysis of variance using GraphPad Prism (n = 3, ** p < 0.01). (B) Thickness of the cell wall in chitinase-silenced strains. There were three biological replicates for each fungal strain (representative pictures are shown). For each line, at least 30 single cell TEM images were captured. The magnifications are 15,000× (bar: 2 μm) and two fields with white frames are further enlarged (100,000×, bar: 200 nm). The black arrows show the inner and outer edges of the cell wall layers. (C) Statistical plot of cell wall thickness quantification. Asterisks indicate significant differences compared to the WT strain according to two-way analysis of variance using GraphPad Prism (n = 3, ** p < 0.01).

