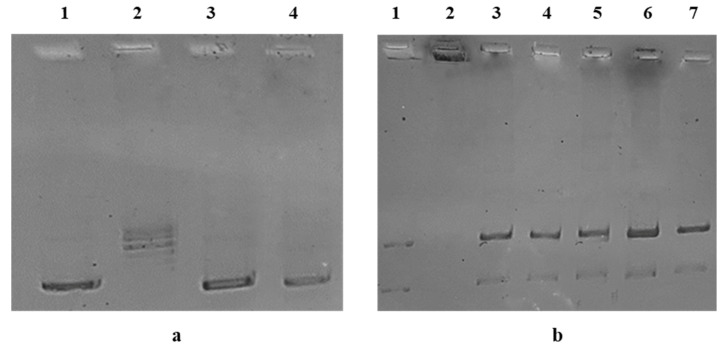
Figure 3.
(a) hTopo I supercoiled relaxing activity. hTopo I was exposed to the vehicle alone (DMSO, lane 2) or compounds 3 and 4 at the concentration of 1 μM (lanes 3 and 4). Then, the hTopo I reaction products were visualized on agarose gel. Supercoiled DNA (plasmid pHOT1) was used as marker (lane 1). (b) hTopo II decatenation assay. hTopo II was exposed to the vehicle alone (DMSO, lane 3) or compounds 3 and 4 at the concentrations of 1 μM (lanes 4 and 5) and 10 μM (lanes 6 and 7). Then, the hTopo II reaction products were visualized on agarose gel. Decatenated DNA and kinetoplast DNA (kDNA) were used as markers (lanes 1 and 2).

