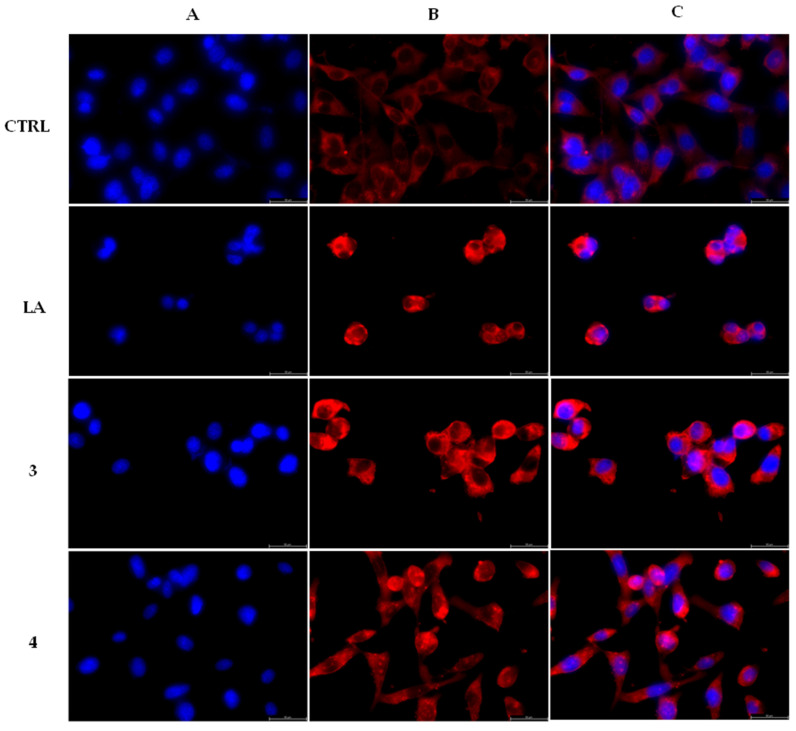
Figure 4.
Actin immunofluorescence studies. MDA-MB-231 cells were exposed for 24 h to the vehicle alone (CTRL), 0.1 μM LA or carbazole derivatives 3 and 4 (used at their IC50 values). Then the cells were further processed, as indicated in the experimental section. The inverted fluorescence microscope was adopted to observe and image all the immunofluorescence figures (40× magnification). Panels A: nuclear stain with DAPI (λex/λem = 350/460 nm); Panels B: β-actin (Alexa Fluor® 568; λex/λem = 644/665 nm); Panels C show a merge. Representative fields are reported.

