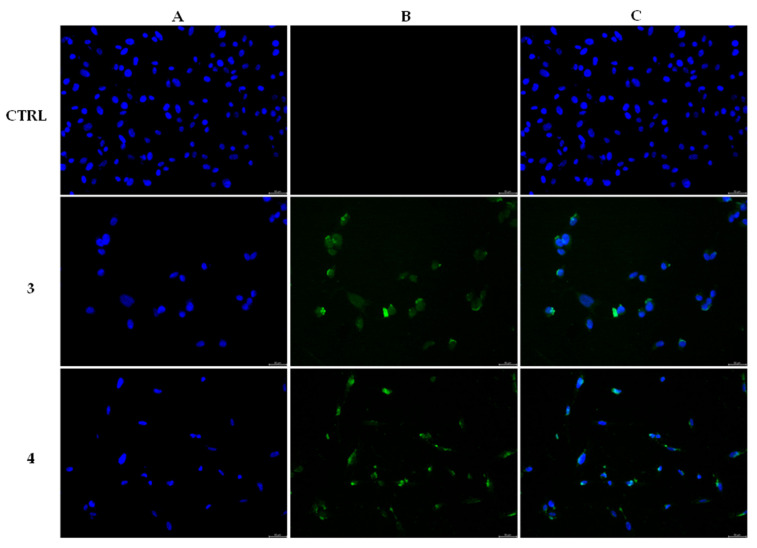
Figure 6.
Tunel Assay. MDA-MB-231 breast cancer cells were treated with compounds 3 and 4 at the concentration equal to their IC50 values or with vehicle (CTRL) for 24 h. Then they were exposed to the TdT enzyme, further processed (see experimental section for more details) and visualized under a fluorescence microscope (20× magnification). Panels A: DAPI, λex/em= 350 nm/460 nm. Panels B: CFTM488 A, λex/em = 490 nm/515 nm. Panels C show the overlay channels.

