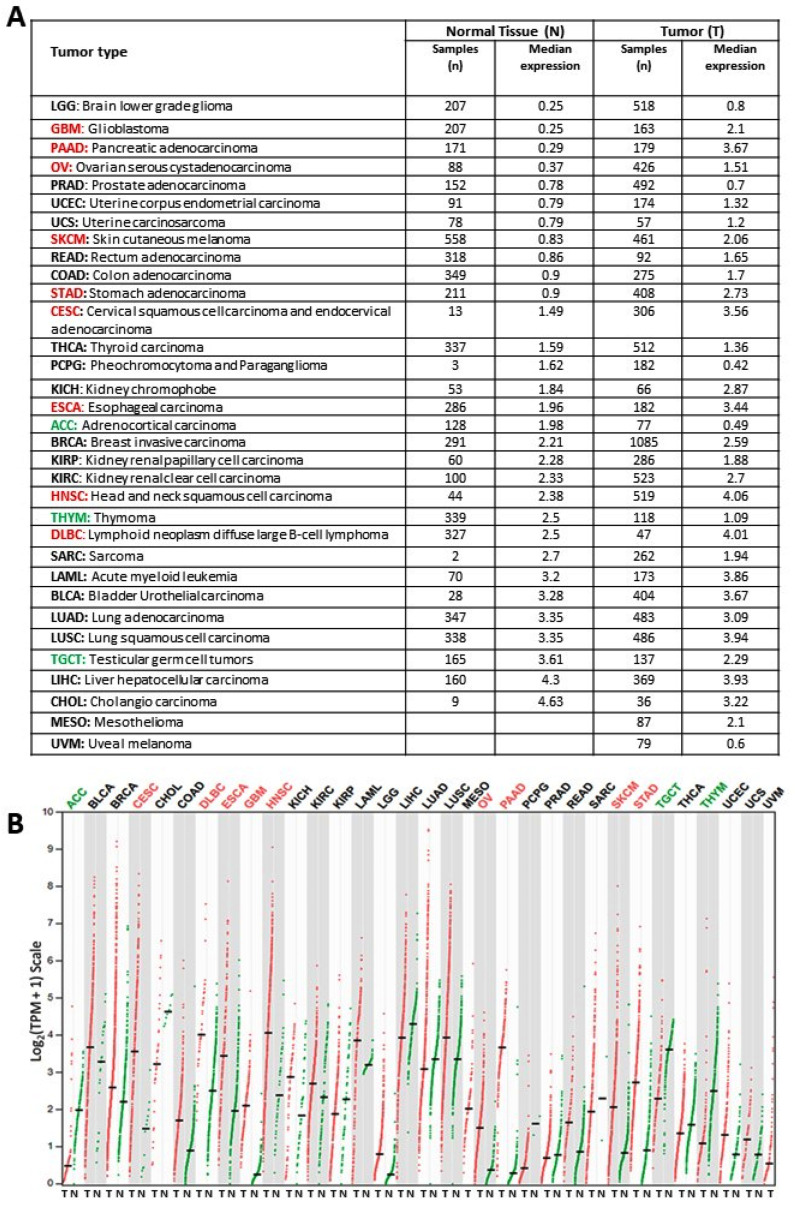
Figure 2.
KYNU expression using TCGA tumor samples (T, red) and corresponding TCGA-GTEx normal tissues (N, green) for different tumors: (A) the KYNU median expression and (B) dot plot, where each dot represents the KYNU expression of a sample, and the black horizontal line represents the median expression.

