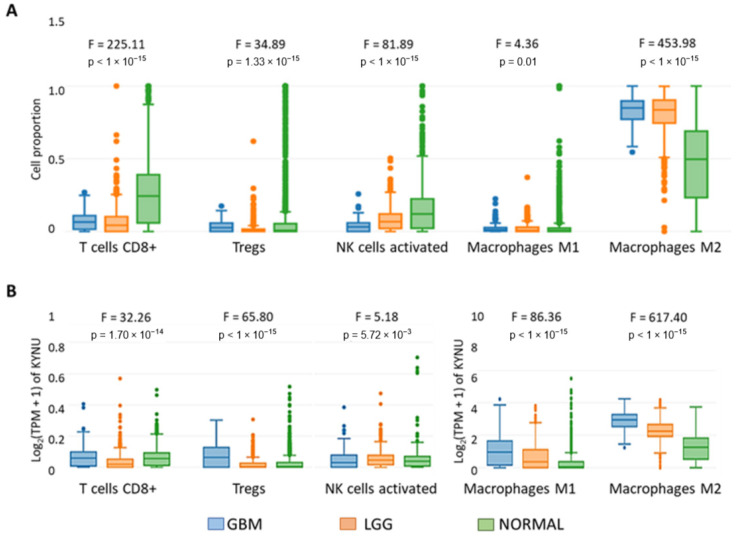
Figure 7.
Infiltration level of immune cells: T cells CD8+, Tregs, activated NK cells, macrophages M1 and macrophages M2. For each cell type, the boxplots represent (A) its proportional distribution in each bulk sample (with normalization) and (B) the KYNU expression distribution, considering the samples associated with GBM (TCGA), LGG (TCGA) and Normal (GTEx-Brain). The p-values refer to the one-way ANOVA to compare GBM, LGG and Normal.

