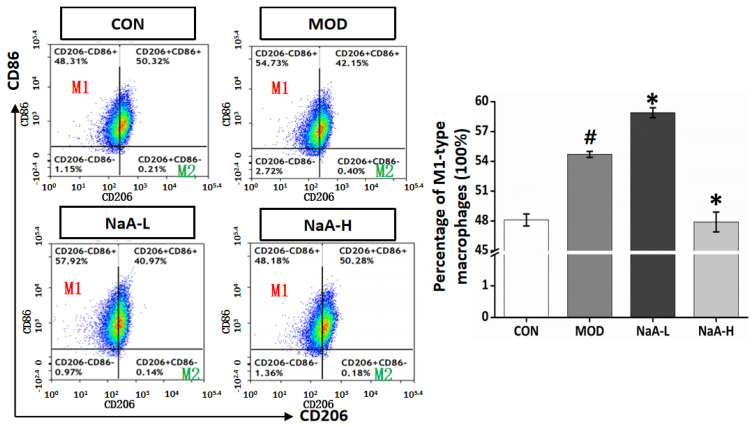
Figure 3.
NaA alters the ratio of M1 macrophages in RAW264.7 stimulated by LPS. RAW264.7 cells were pretreated with NaA (0.1, 2 mM) for 18 h before treatment with LPS (100 ng/mL). Cells were harvested at 6 h of LPS incubation for further flow cytometry analysis. For all bar graphs, data are the mean ± SD, # p < 0.05, as compared with CON, and * p < 0.05, as compared with MOD. The significant difference was assessed using the one-way ANOVA followed by LSD post-tests. Control group (CON), group model cell treated with an LPS (MOD), 0.1 mM sodium acetate group (NaA-L), 2 mM sodium acetate (NaA-H), arbitrary unit (AU).

