Figure 4.
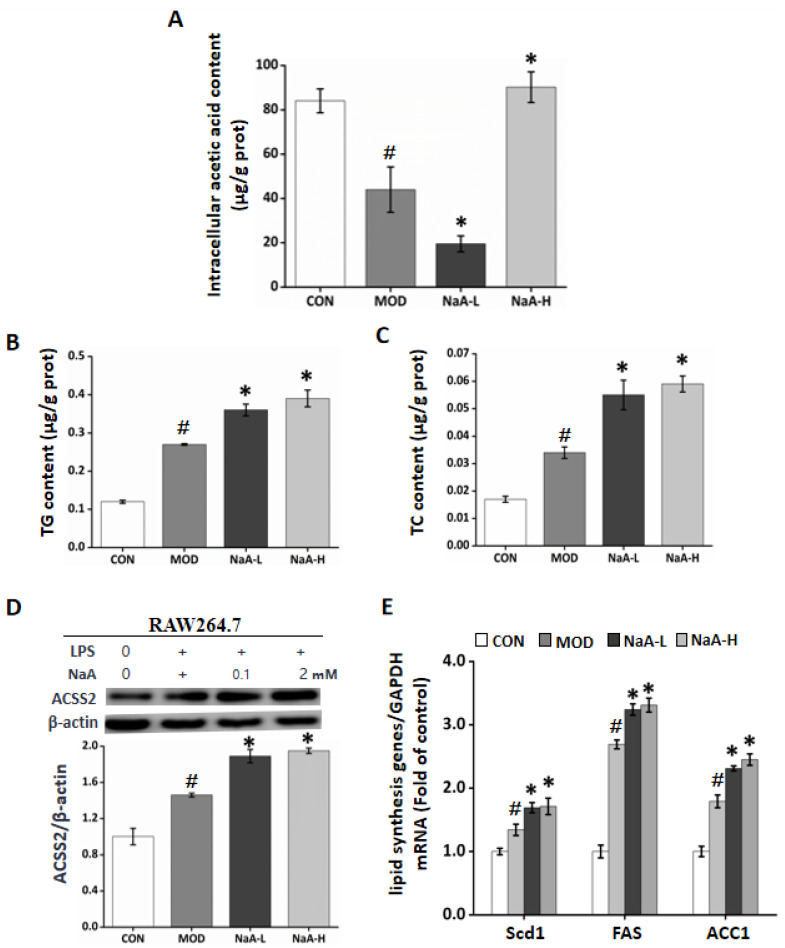
NaA alters intracellular free acetate content by promoting lipid synthesis in macrophages in a dose-related manner. (A) NaA regulated intracellular acetic acid content in a dose-dependent manner. (B) NaA increased intracellular TG content. (C) NaA increased intracellular TC content. (D) NaA enhanced the expression of ACSS2 protein, determined by Western Blot (E) qRT-PCR showed that NaA increased mRNA expression of lipid synthesis genes (Scd1, FAS, ACC1). For all bar graphs, data are the mean ± SD, # p < 0.05, as compared with CON, and * p < 0.05, as compared with MOD. The significant difference was assessed using the one-way ANOVA followed by LSD post-tests. Control group (CON), group model cell treated with an LPS (MOD), 0.1 mM sodium acetate group (NaA-L), 2 mM sodium acetate group (NaA-H), arbitrary unit (AU).

