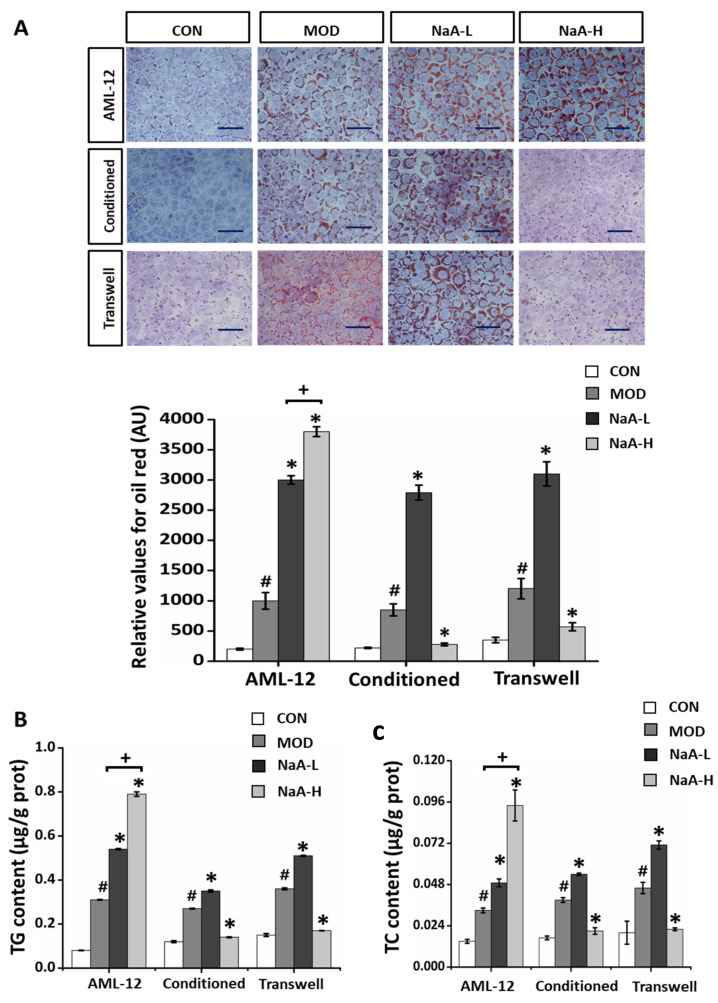
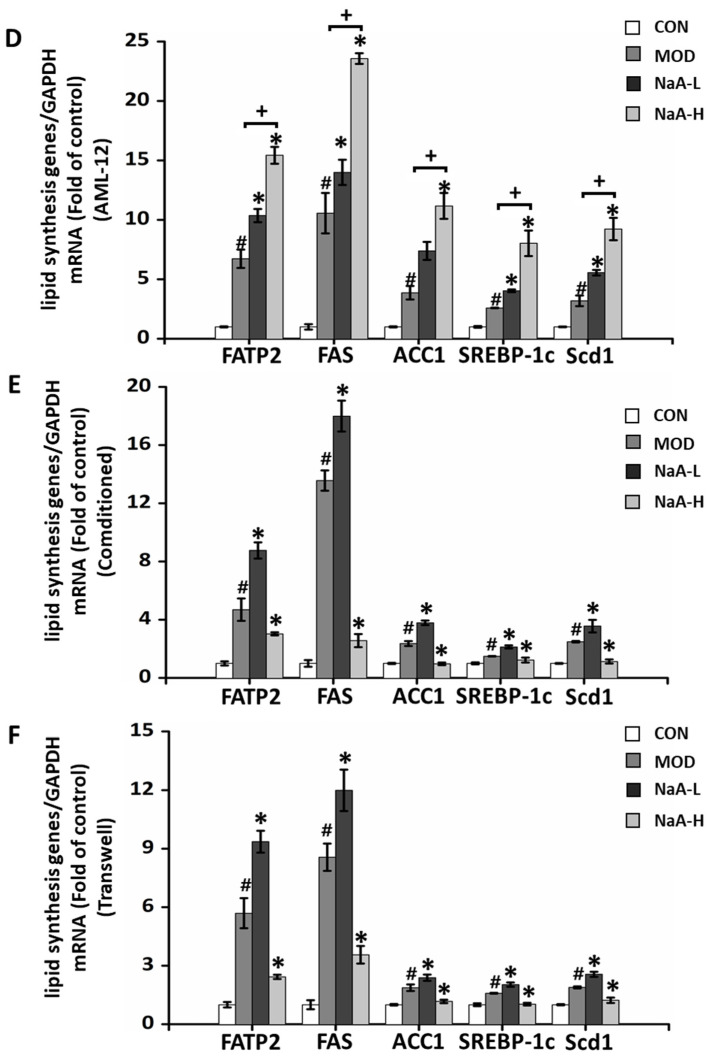
Figure 7.
NaA affects the lipid accumulation of hepatocytes by regulating macrophage activity. (A) Oil Red O staining was used to detect the lipid deposition (magnification: 100×, scale bar: 500 μm). The bar graph displays percentages of lipid accumulation (n = 6–10). (B) The levels of hepatic triglycerides. (C) The levels of hepatic cholesterol. (D–F) qRT-PCR was used to evaluate the mRNA expressions of lipid synthesis genes (Scd1, FAS, ACC1, SREBP, FASn). For all bar graphs, data are the mean ± SD, # p < 0.05, as compared with CON, * p < 0.05, as compared with MOD, + p < 0.05. The significant difference was assessed using the one-way ANOVA followed by LSD post-tests. Control group (CON), group model cell treated with an LPS (MOD), 0.1 mM sodium acetate group (NaA-L), 2 mM sodium acetate group (NaA-H), arbitrary unit (AU).


