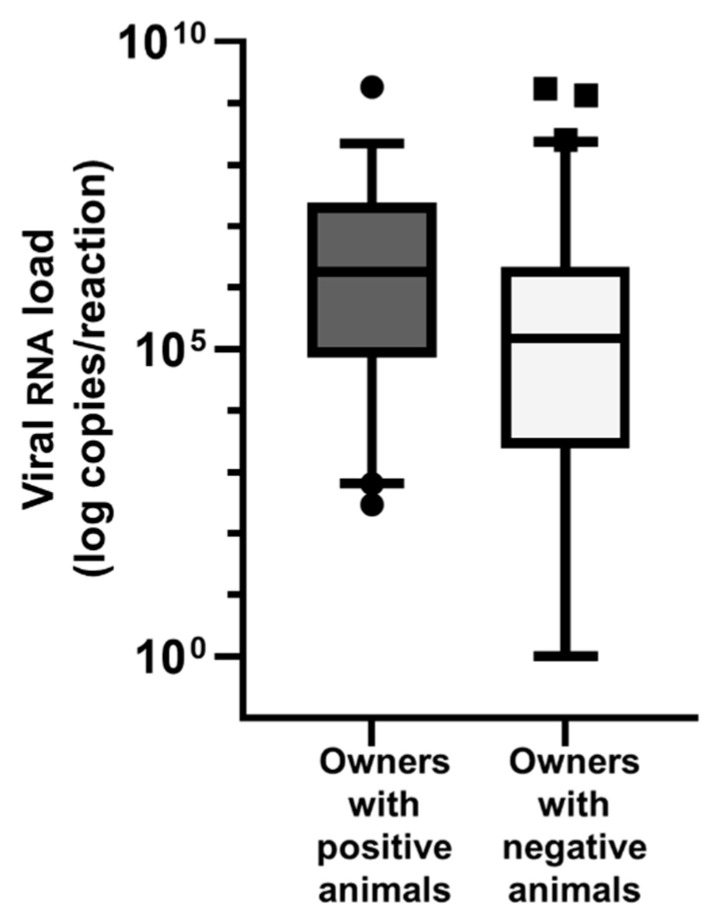
Figure 4.
Relationship between the viral RNA load of samples from people and the positivity status of animals in the same household. A mean copy number value was calculated for each sample from the RT-qPCR results of the E-assay and the RdRp-assay. Box and whiskers plot: boxes extend from 25% to 75%, whiskers from 5% to 95%. Owners with SARS-CoV-2 positive animals had significantly higher viral RNA loads than owners with SARS-CoV-2 negative animals (p = 0.0085).

