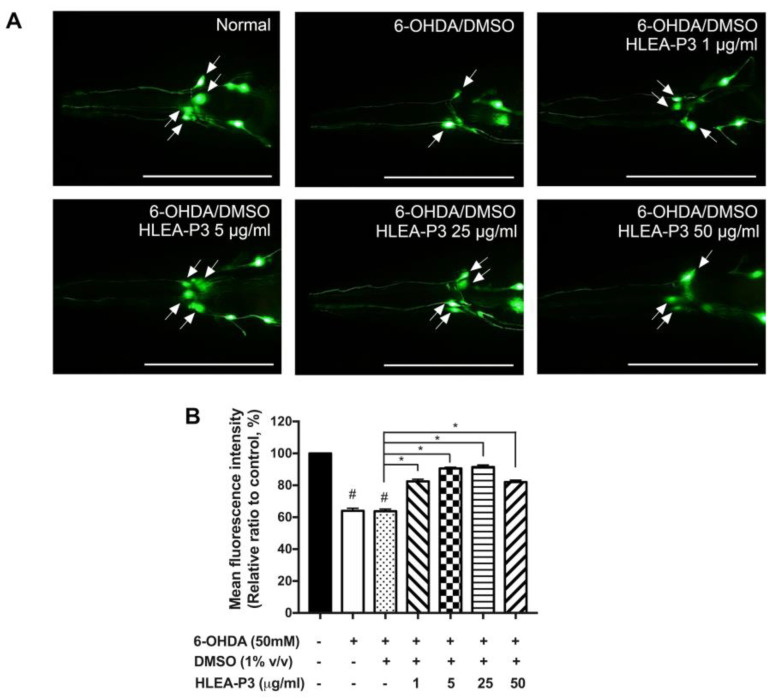
Figure 1.
HLEA-P3 attenuated DAergic neurodegeneration induced by 6-OHDA in C. elegans model. (A) Representative fluorescence images of GFP-tagged CEP neurons (arrows) of normal BY250, 6-OHDA/DMSO-treated BY250 and BY250 exposed to 6-OHDA and treated with HLEA-P3 at doses of 1, 5, 25 and 50 μg/mL. (B) Graphical representations for the relative fluorescence intensity of GFP-tagged CEP neurons. The data are presented as a mean ± SEM (n = 30, number of animals). The hash (#) indicates a significant difference between normal and 6-OHDA-treated groups (p < 0.05). The asterisk (*) indicates significant differences between the untreated group (6-OHDA/DMSO) and HLEA-P3-treated groups at p < 0.05. Scale bar is 100 μm.

