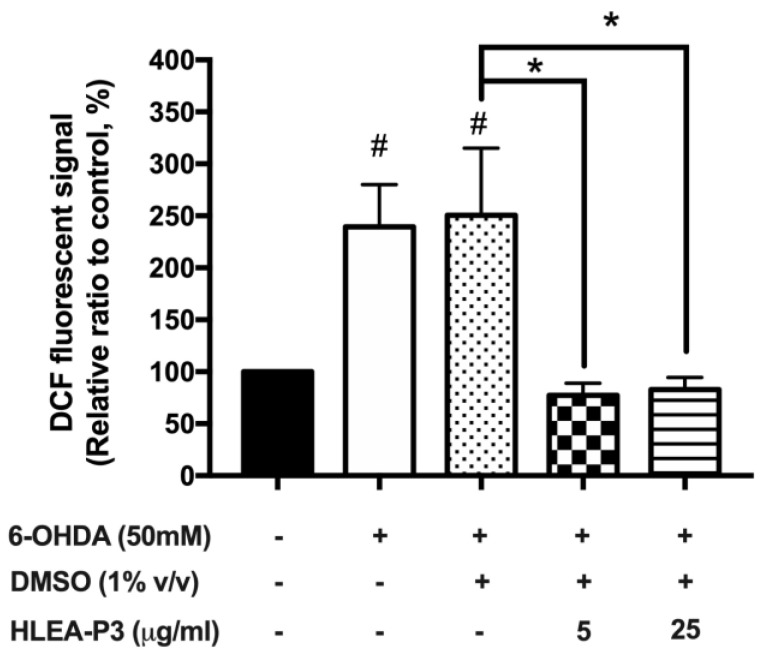
Figure 3.
HLEA-P3 reduced oxidative stress in 6-OHDA-treated C. elegans. Graphical representations for relative changes in intracellular ROS levels using H2DCF-DA. The data are presented as mean ± SEM (three independent replicates, n = 30 number of animals per replicate). The hash (#) indicates a significant difference between normal and 6-OHDA-treated groups. The asterisk (*) indicates significant differences between the untreated group (6-OHDA/DMSO) and HLEA-P3-treated groups, * p < 0.05.

