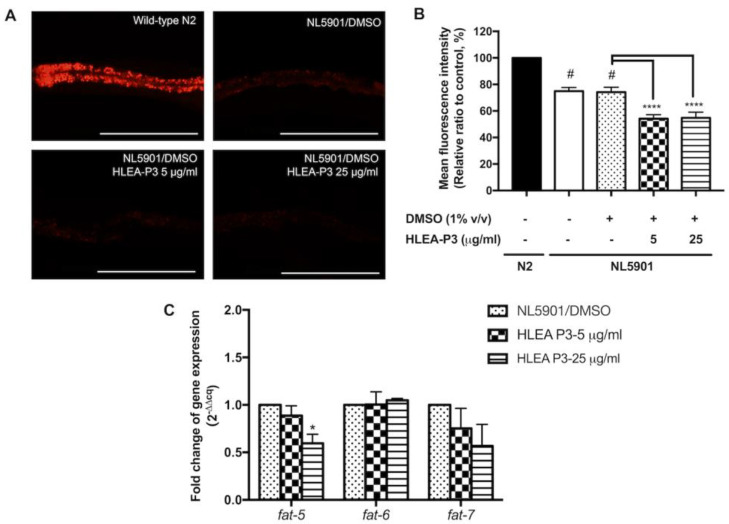
Figure 5.
HLEA-P3 modulated lipid deposition in transgenic C. elegans NL5901 strain. (A) Representative Nile red fluorescence images of wild-type N2, C. elegans NL5901 and C. elegans NL5901 treated with HLEA-P3 at 5 and 25 μg/mL. (B) Graphical representation for Nile red fluorescence signal. The data are presented as mean ± SEM (with three independent replicates, n ≥ 30 number of animals per replicate). (C) Graphical representation for fold changes of fatty acid desaturase genes: fat-5, fat-6 and fat-7. The data are presented as mean ± SEM (with three independent replicates, n = 800–1000 number of animals per replicate). The hash (#) indicates a significant difference between wild-type N2 and NL5901 worms (p < 0.05). The asterisk (*) indicates significant difference between the untreated group (DMSO) and HLEA-P3-treated groups, * p < 0.05, **** p < 0.0001. Scale bar is 200 μm.

