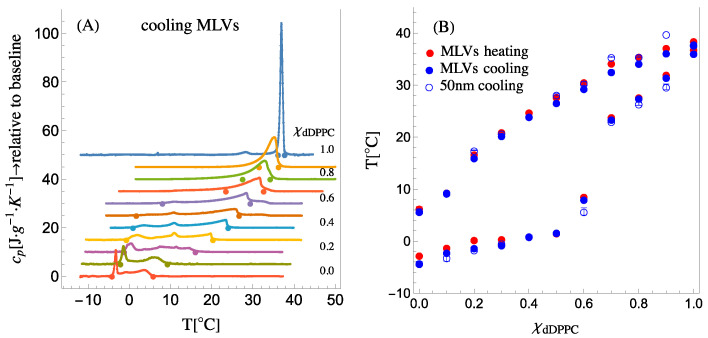
Figure 2.
(A) Cooling calorimetry traces for MLVs for mixtures of dDPPC:DLPC. Large dots mark the onset and the completion temperatures of the transition. The dots trace the liquidus and the solidus boundaries. (B) The composition, , vs. temperature, T, plot corresponding to the phase diagram for the dDPPC:DLPC system. The solid dots correspond to MLVs, blue for cooling and red for heating. The open blue circles correspond to 50 nm SUVs during cooling. Error bars correspond to at least two calorimetry scans (see Figure S3.1 and Table S3.1 in Section S3 of the Supplementary Information for details).

