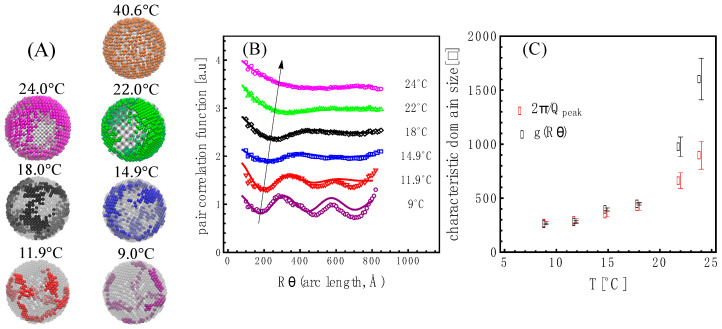
Figure 5.
(A) Bead models as a function of temperature. At 40.6 °C, the two-color beads represent dDPPC—golden—and DLPC molecules—light gray—in the fluid state and where . At 24 °C and lower temperatures, in which the system is in the two-phase coexistence region, the colored beads represent the liquidus phase while the light gray beads correspond to the solidus phase. The corresponding scattering from these structures is shown in Figure 4A. The error on the volume fraction is as shown in Figures S8.1 and S8.2 in Section S8 of the Supplemental Information. Table S8.1, in Section S8 of the Supplemental Information, lists the corresponding volume fraction of the liquidus obtained. (B) Pair correlation function, g(Rarc length). The curves are offset for clarity. The curves correspond to fits with an exponentially attenuated cosine function. The arrow indicates the increase in wavelength. (C) The characteristic length obtained from fitting g(Rarc length) as a function of temperature (black symbols). The characteristic length obtained from the scattering peak is plotted as well (red symbols).

