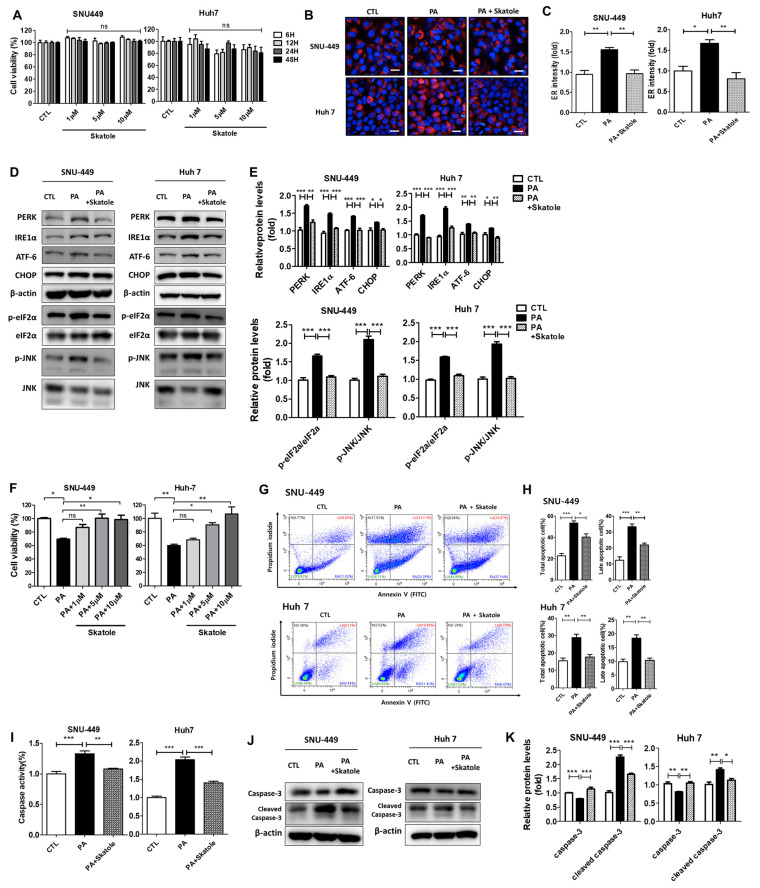
Figure 4.
The attenuating effects of skatole on PA-induced ER stress, apoptosis, and caspase activity in SNU-449 and Huh7 cells. (A) SNU-449 and Huh7 cells were treated with different concentrations (1–10 μM) of skatole for different times (6–48 h), and cell viability was detected. (B) SNU-449 and Huh7 cells were treated with 0.25 mM PA and 5 μM skatole for 24 h. ER staining was performed using ER-tracker. (C) The relative ER fluorescence intensity was measured using Columbus software. (D) Cells were treated with the same conditions as in (B), and the levels of ER stress markers in treated cells were analyzed by Western blot analysis. (E) The relative levels of ER stress markers (PERK, IRE1α, ATF-6, and CHOP) were normalized with β-actin. Phosphor-eIF2α and phosphor-JNK were normalized to total eIF2α and JNK, respectively. (F) SNU-449 and Huh7 cells were treated with 0.25 mM PA and 1–10 μM skatole, and cell viability was measured. (G) Apoptotic cells were separated by the FCM assay of Annexin V and PI double staining. (H) Total apoptotic and late apoptotic cell populations were determined based on (G). (I) Cells were treated with PA and skatole with the same conditions as above. Hepatic caspase activity was evaluated using a fluorometric assay. (J) Apoptosis-related protein expression levels in treated SNU-449 and Huh7 cells were detected using Western blot analysis. (K) Relative protein levels of the apoptosis-related proteins, caspase-3, and β-actin were used for normalization. Three independent samples were performed for all experiments, and the values are shown as mean ± SD, analyzed by one-way ANOVA. (n = 3–5, *** p < 0.001, ** p < 0.01, * p < 0.05. CTL: control, LV: live cells, EA: Early apoptotic cells, LA: Late apoptotic cells, N: Necrotic cells).

