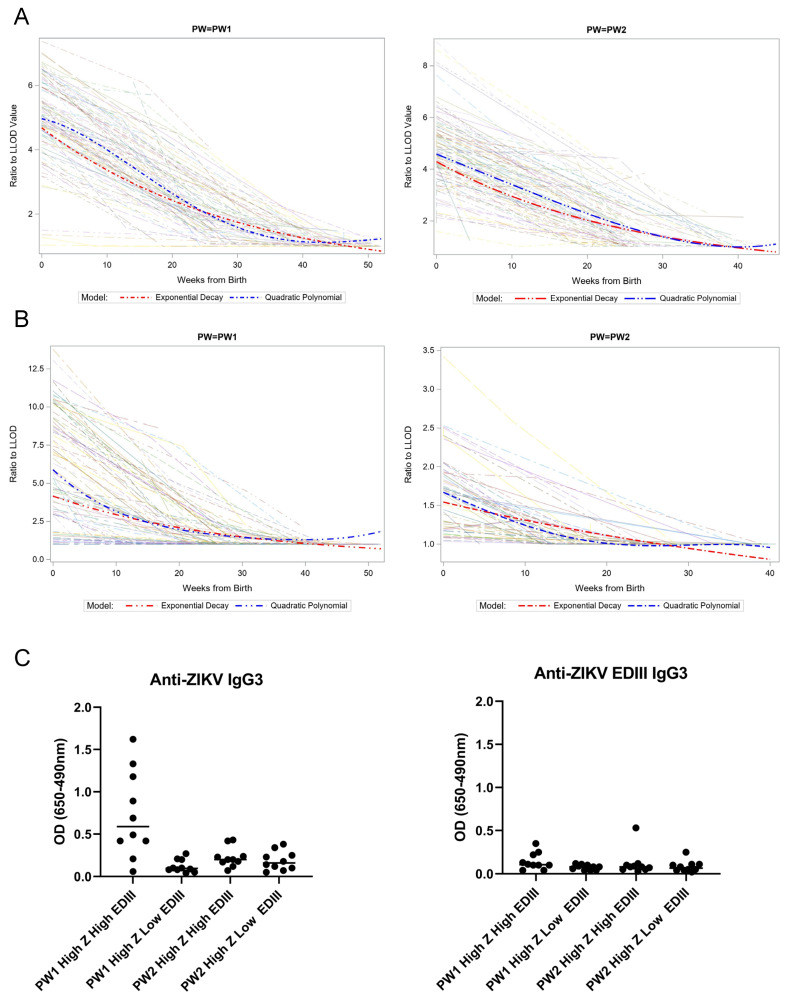
Figure 2.
ZIKV-reactive antibody kinetics and IgG subtype. Decay of IgG reactive to ZIKV (A) and ZIKV EDIII (B) is shown for infants in both PW1 and PW2 cohorts. Spaghetti plots of trajectories were generated from the OD from each ELISA as a ratio to the LLOD, using a continuous time scale of weeks of life for each infant. Data from individual infants are shown as semi-transparent lines. Fit lines summarizing all data were calculated using an exponential decay (red dashed line) and a quadratic polynomial (blue dashed line) model. (C) IgG3 reactivity to ZIKV (left panel) and ZIKV EDIII (right panel) is shown in a subset of cord blood samples (n = 10 per subgroup) from subgroups indicated on the x-axis. OD, optical density; LLOD, lower limit of detection. X-axis legend of left graph of panel C: needs space between LOW and EDIII in the 2 group from left.

