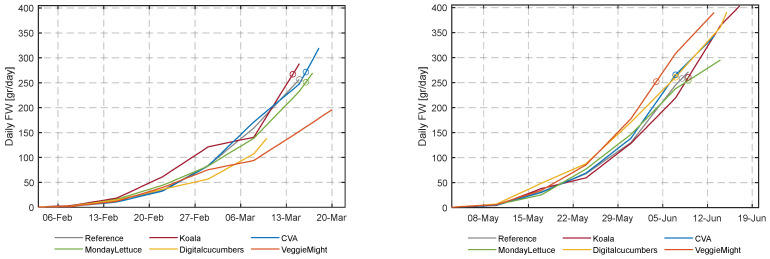
Figure 12.
Development of fresh weight [g/plant] in the different compartments for the first and second cultivation. The curves were obtained by linear interpolation of the weekly randomly sampled plants and (destructively) weighed heads of lettuce. The end of the lines represents the chosen date of harvest and the fresh weight at harvest. The circles (o), represent the days on which the lettuce heads reached the target fresh weight of 250 g.

