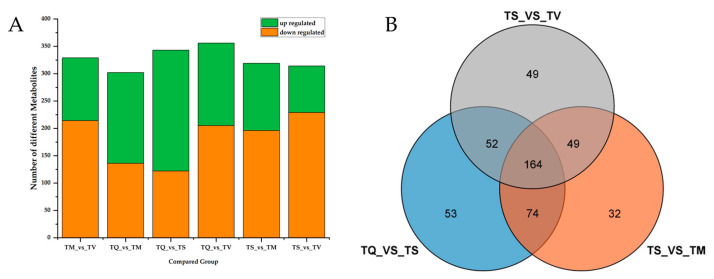
Figure 3.
Differentially accumulated metabolites (DAMs) analysis. TQ: T. quinquecostatus, TS: T. serpyllum, TM: T. marschallianus, TV: T. vulgaris. (A) Bar graph of number of upregulated and downregulated DAMs through pairwise comparisons. (B) Venn graph for DAMs from the pairwise comparisons of TS and three other materials (TV, TQ, TM).

