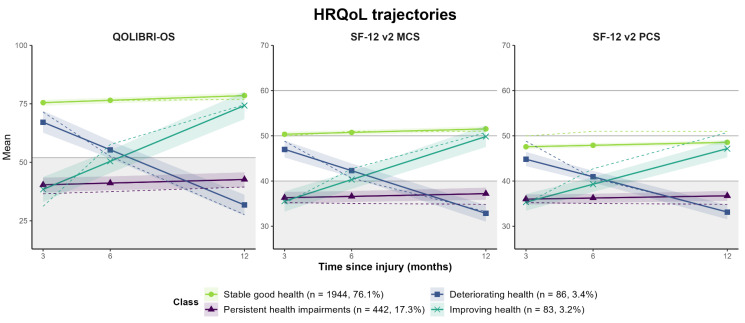
Figure 2.
Generic and disease-specific HRQoL trajectories (QOLIBRI-OS, SF-12 v2 MCS/PCS) for the four-class solution. Solid, colored lines indicate predicted trajectories, dashed lines the observed values. Shaded areas around lines indicate 95% confidence intervals for predicted values. Gray lines mark cut-off for unfavorable values for the QOLIBRI-OS (<53) as well as mean (=50) and standard deviation (+/−10) for the SF-12v2 MCS/PCS. Gray area marks values below the cut-off for unfavorable levels of quality of life (QOLIBRI-OS < 52, SF-12v2 MCS/PCS < 50).

