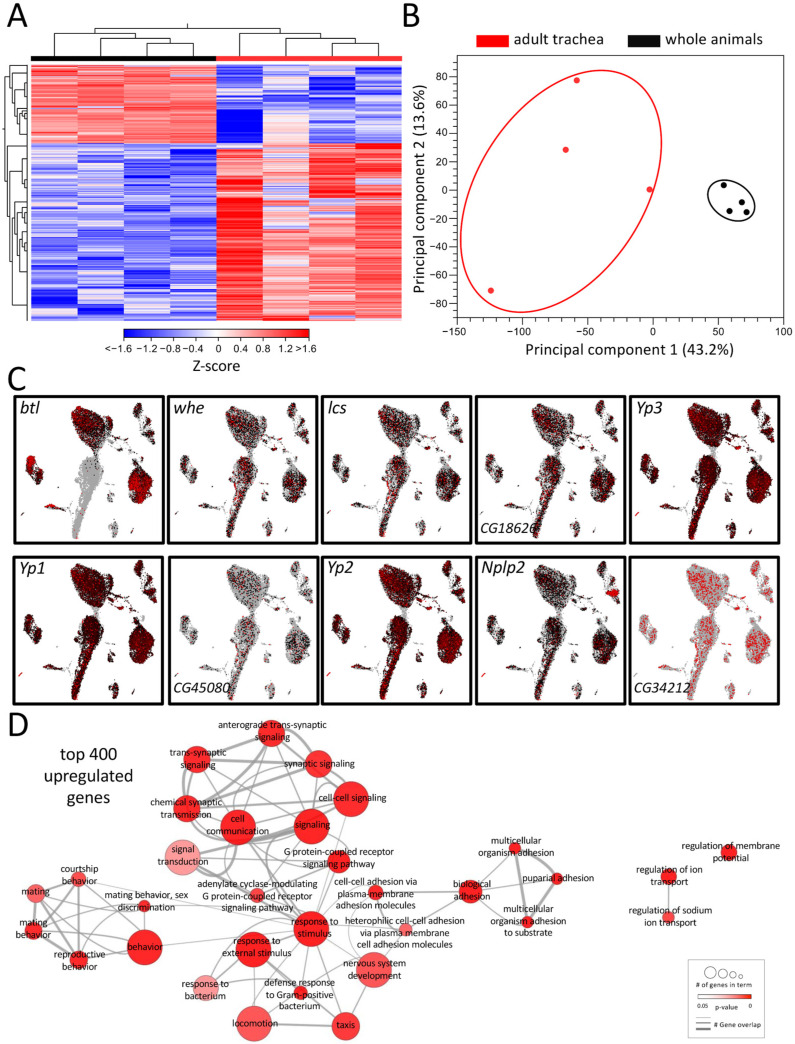
Figure 1.
Transcriptomic analyses of adult respiratory epithelia compared to whole flies. (A) Heatmap of all differentially expressed genes (DEGs) between adult trachea (red) and whole flies (black). DEG cutoff: fold-change > 1.5. (B) PCA of all replicates from adult trachea and whole flies. Circles were added manually. (C) Transcript plots of selected genes showing high abundances in the RNAseq experiments based on the Drosophila single-cell atlas https://scope.aertslab.org/#/FlyCellAtlas/FlyCellAtlas%2Fs_fca_biohub_trachea_10x_ss2.loom/gene, accessed 12 December 2022 [28]. (D) GO analysis with the top 400 upregulated DEGs with a cutoff value of FDR < 0.05. Node size represents the number of associated genes in the GO term. The node color represents the p-value. Edge appearance represents the number of shared genes between the GO terms.

