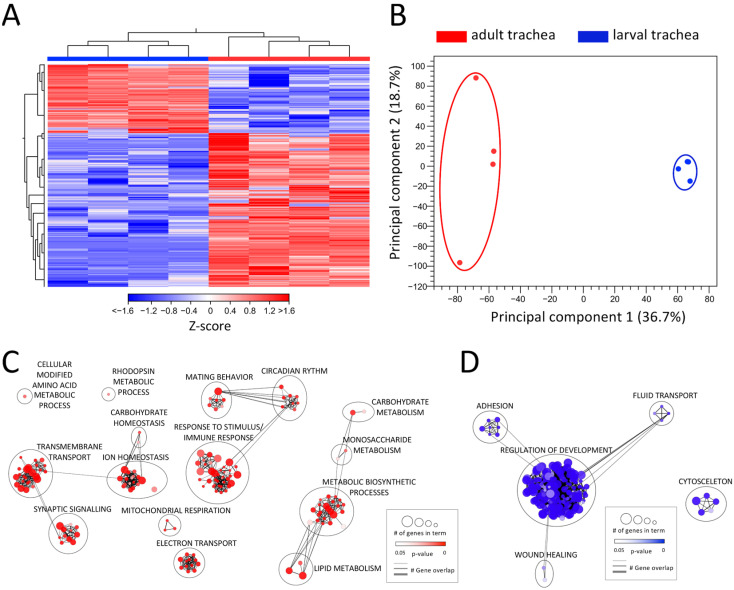
Figure 2.
Comparing the transcriptomic signatures of adult and larval trachea. (A) Heatmap of all DEGs between adult tracheal (red) and larval trachea (blue). (B) PCA of all replicates from adult trachea and larval trachea. Circles were added manually. (C,D) GO analysis with the upregulated (C) and downregulated (D) DEGs with a cutoff value of FDR < 0.05. Node size represents the number of associated genes in the GO term. The node color represents the p-value. Edge appearance represents the number of shared genes between the GO terms.

