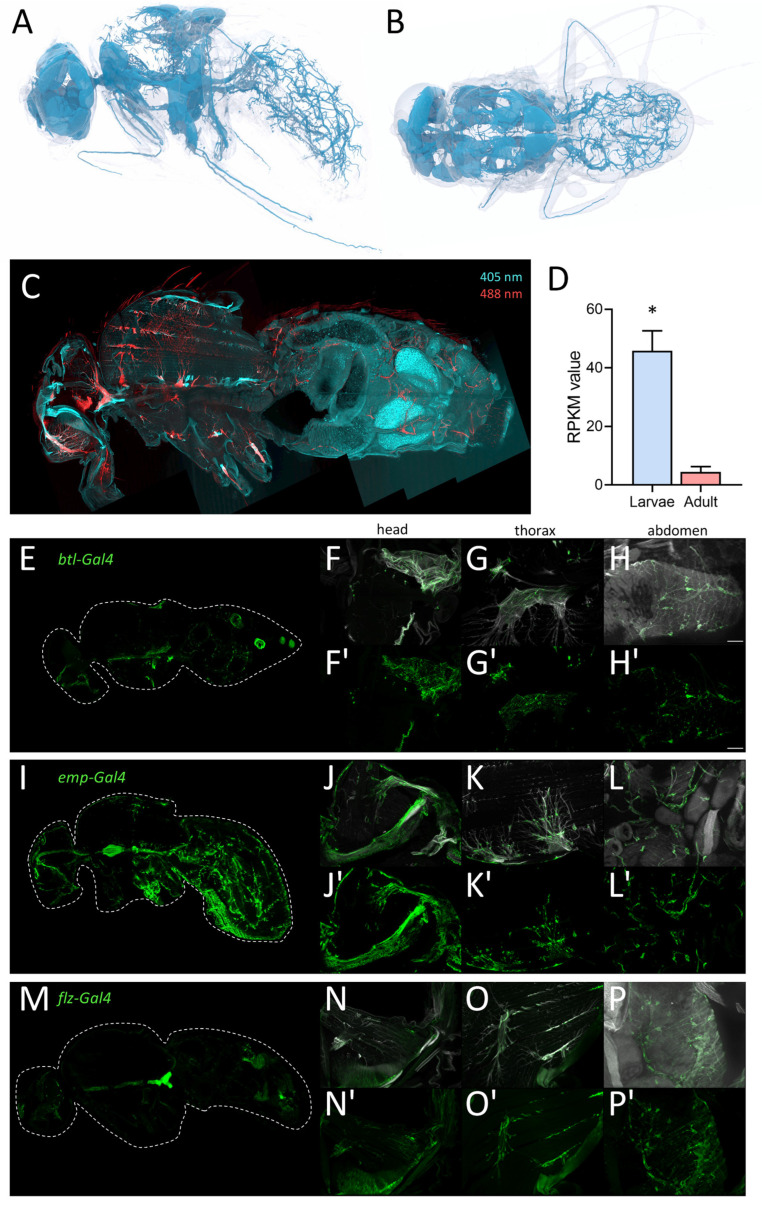
Figure 8.
Morphology of the tracheal system in adult animals. (A,B) Structure of the tracheal system of adult flies as evaluated by micro-CT analysis, lateral (A) and dorsal view (B). To visualize tracheal structures in adults, we also employed autofluorescence (C). Here, longitudinal sections were analyzed with a confocal laser scanning microscope. The tracheal cells were excited by 405 nm (cyan; detection 460 nm) and 488 nm (red, detection 516 nm) lasers and detected for corresponding autofluorescence of the trachea in the head, thorax, and abdomen (C). (D) RPKM values of larval (blue) and adult (red) trachea for the canonical trachea driver gene btl. Asterisk indicates a differential gene expression based on the RNA-Seq analysis. (E–P’) Expression of tracheal specific Gal4 driver lines in whole fly, head, thorax, and abdomen. Sagittal sections of btl-Gal4 (E–H’), emp-Gal4 (I–L’) and flz-Gal4 (M–P’) crossed to UAS-GFP were stained with an anti-GFP nanobody. Tracheal air sacs and branches were simultaneously visualized with UV light (white; F–H, J–L, N–P). Detailed magnification of the head (F,F’,J,J’,N,N’), thorax (G,G’,K,K’,O,O’) and abdomen (H,H’,L,L’,P,P’) are shown. Scale = 50 µm.

