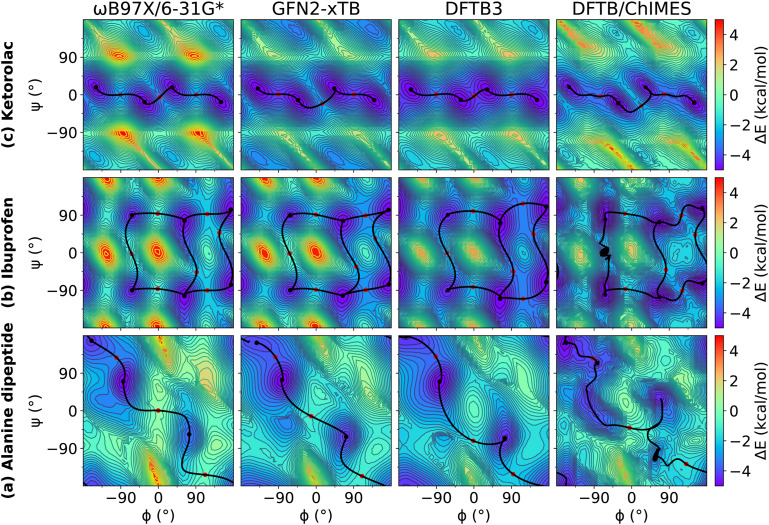
FIG. 2.
Relaxed 2D torsion profiles for (a) alanine dipeptide; (b) ibuprofen; and (c) ketorolac. Each molecule was computed using ωB97X/6-31G*, GFN2-xTB, DFTB3, and DFTB/ChIMES, respectively. The reference level of theory is ωB97X/6-31G*. The color bars represent the potential energy (with respect to the minimum energy) in kcal/mol.

