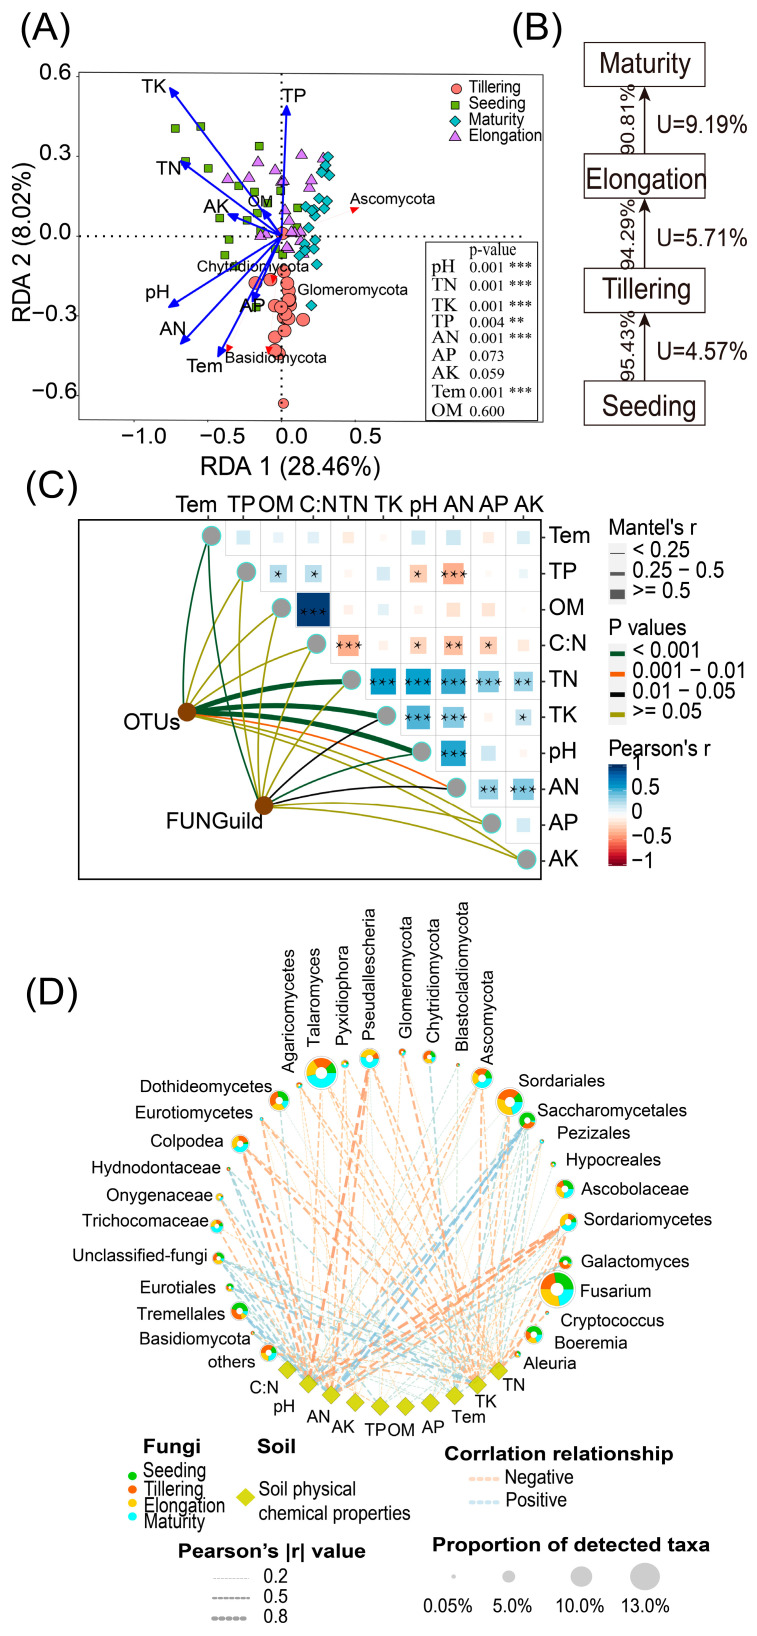
Figure 4.
(A) Redundancy analysis (RDA) of soil properties and dominant Fungal phylum. In the part of the bottom right, the soil properties were fitted to the ordination plots using a 999 permutations test (p-values), significance: *** p < 0.001, ** p < 0.01, * p < 0.05. (B) Source analysis of sugarcane rhizosphere microorganisms. Source environment proportions for 84 samples of different stages were estimated using the Source Model of Plant Microbiome (SMPM). The number represents the proportion of fungal transmission in the adjacent period, and the letter U represents the proportion of microorganisms from unknown sources. (C). Environmental drivers of sugarcane rhizosphere fungal community composition. Pairwise comparisons of environmental factors are shown, with a color gradient denoting Pearson’s correlation coefficients. Edge width corresponds to the Mantel’s r statistic for the corresponding distance correlations, and edge color denotes the statistical significance based on 9,99 permutations. (D). Co-occurrence network of the mainly fungus genus population and soil properties in rhizosphere soils.

