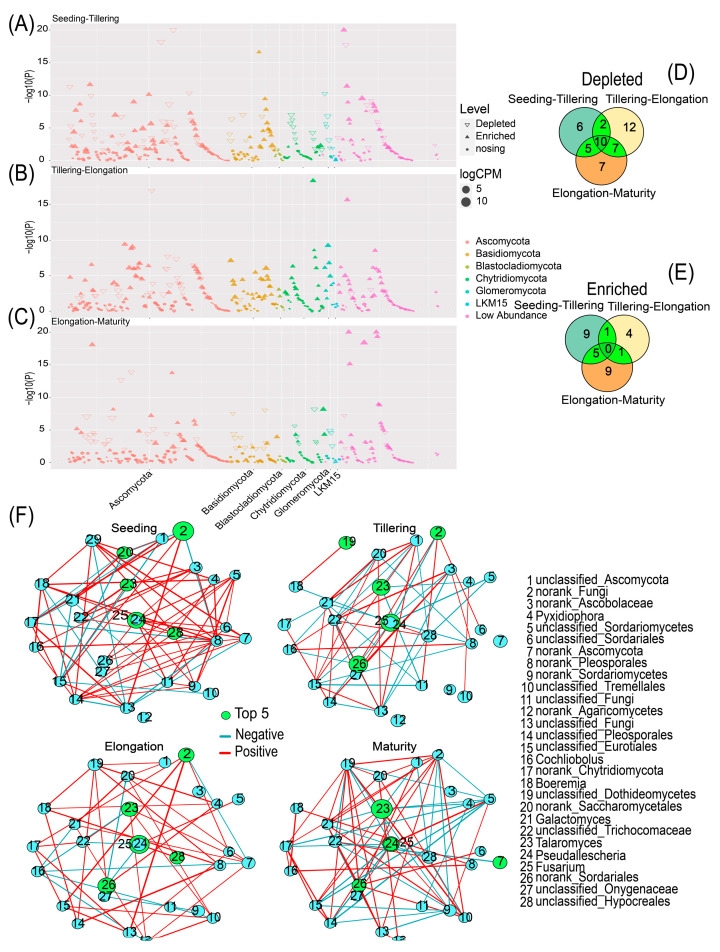
Figure 5.
Taxonomic of differential fungi between the two periods of root microbiota. The Manhattan plot shows OTUs enriched or decreased in sugarcane in different stages. Each dot or triangle represents a single OTU. OTUs enriched or decreased in the sugarcane rhizosphere are represented by filled or empty triangles, respectively (FDR adjusted p < 0.05, Wilcoxon rank sum test). OTUs are arranged in taxonomic order and colored according to the phylum. (A) Seeding vs. Tillering; (B) Tillering vs. Elongation; (C) Elongation vs. Maturity. (D) Venn diagram of fungi decreasing between successive stages at the genus level. (E) Venn diagram of fungi enriched between successive stages at the genus level. (F) Co-occurrence network based on spearman correlation (Top 28 fungal genera, |r| > 0.4, p < 0.05), the size of the circles represents the relative abundance of the fungal genera and the thickness of the lines represents the size of the correlation.

