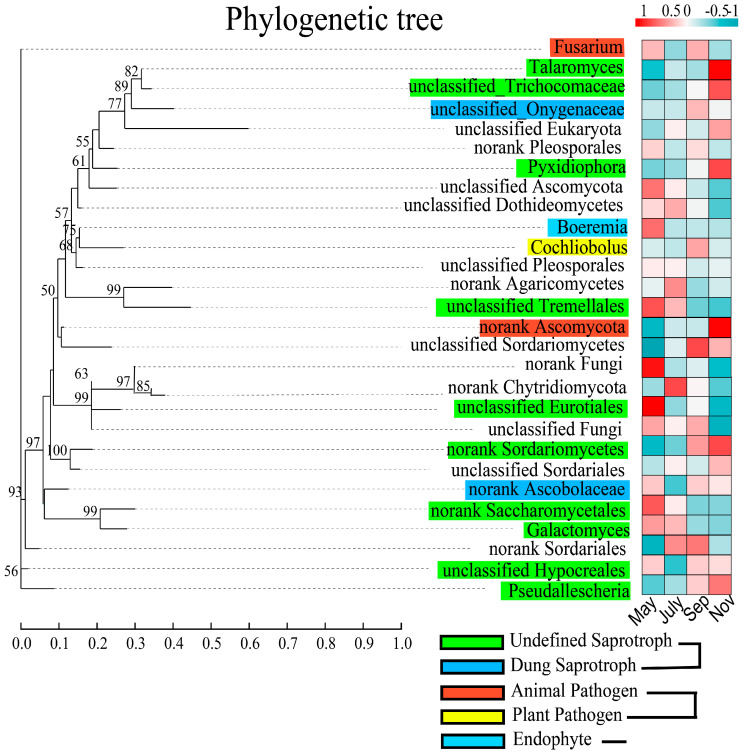
Figure 8.
Phylogram with fungal guilds of the top 28 fungal genera, color the branches according to the phylum level to which the species belongs; maximum likelihood tree for the sequences obtained through high-throughput sequencing. The relative abundance data were normalized using the Z-score method, and then the average of the relative abundance of each genus for each group of samples was plotted as a heat map, the bar chart showed the percentage of Reads for the species in different stages. Guild annotation used the FUNGuild database.

