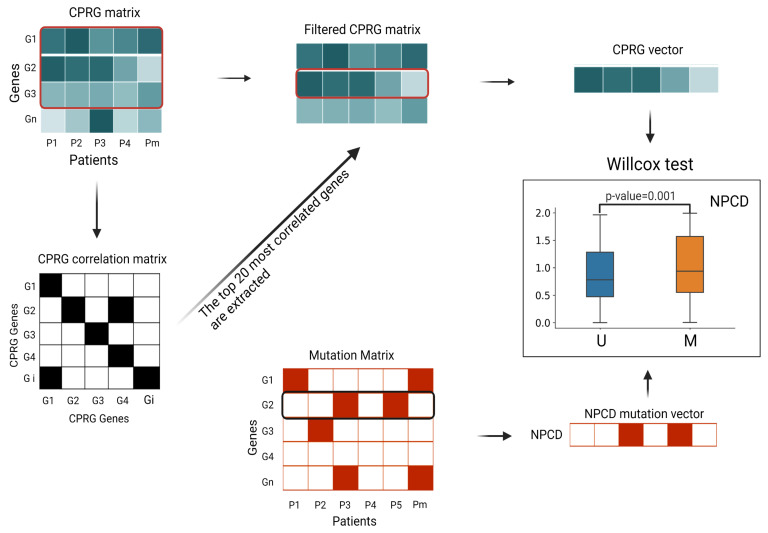
Figure 7.
Flow chart of DNA replication function correlation test. (1) We extracted the fraction of all CPRGs from the (n is the number of samples) of each tumor type and created the . (2) According to the Spearman correlation coefficient threshold, we generated (symmetric matrix). (3) We selected the top 20 genes with the highest correlation in the CPRG matrix and extracted the top 20 genes from the CPRG matrix to produce the . (4) The mean expression level of each CPRG in the filtered CPRG matrix was used to calculate the linear regression parameters for each sample, as the CPRG vector for the sample. The CPRG vectors were divided into mutation/nonmutation vectors according to the mutation matrix, and the Wilcoxon test was performed on the distributions of these two vectors to compute the p-values. The box plots are drawn for each NPCD by the two sample-population distributions (Figure 8).

