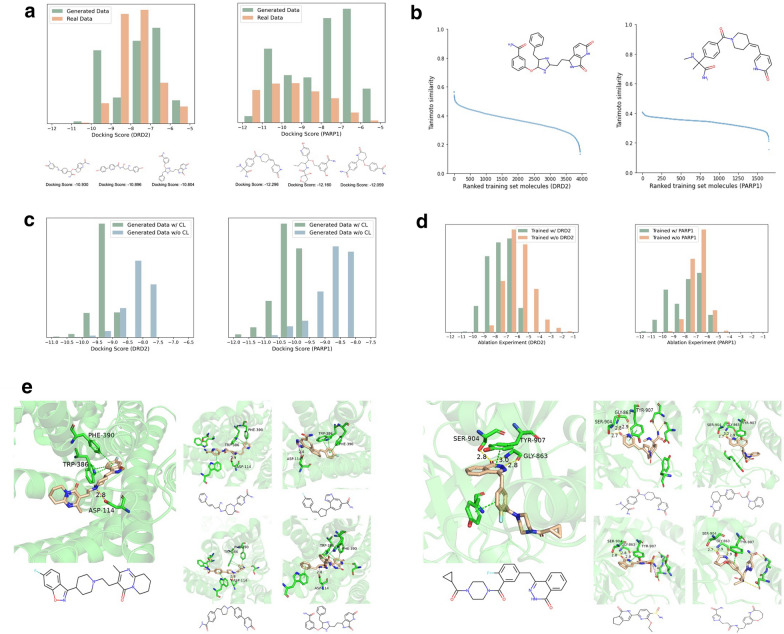
Fig. 3.
a The docking score result and some samples with top score of DRD2 (left) and PARP1 (right). Green is known molecules, yellow is generated. The Lower docking score indicates higher binding affinity. b Tanimoto similarity between generated molecule and each molecule in the training dataset. c The difference of top 1000 molecules’ Docking Score distribution when contrastive learning is or isn’t used. The left is from DRD2 and the right is from PARP1. d The docking score result of Zero-shot generation to unseen targets. e Generated molecules with top binding affinity and the reference molecule for representative binding sites. The known inhibitors (the big image) and the generated molecules (the small four images) of DRD2 (left) and PARP1 (right)

